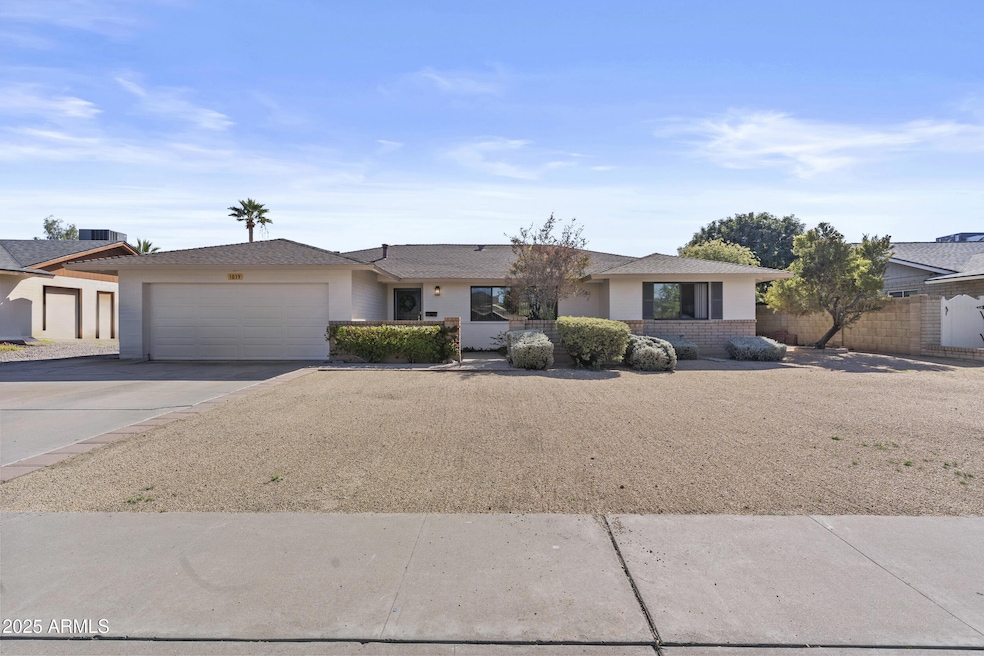
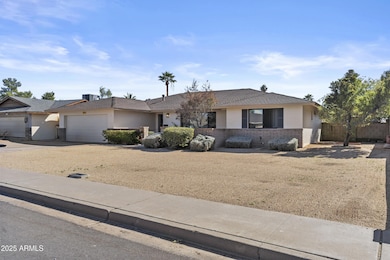


1019 E Watson Dr Tempe, AZ 85283
The Lakes NeighborhoodEstimated payment $3,376/month
Highlights
- 0.21 Acre Lot
- Covered Patio or Porch
- No Interior Steps
- No HOA
- Double Vanity
- Shed
About This Home
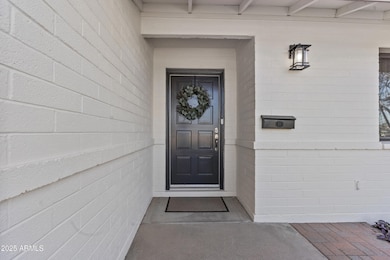
New Price! Front courtyard entry greets you in this popular floor plan by well respected Suggs builder. TRUE 5 bedroom split layout, could make for a great home office and teen retreat or home gym, etc. Gorgeous backyard with meandering paths and lush desert landscaping. Back patio is spacious and inviting for entertaining as it is accessible from 3 sets of French doors. Quality construction and well cared for is a perfect pairing for your next home! New exterior and interior paint. Location is hard to beat in South Tempe with freeway access, plus close proximity to Sky Harbor Airport, Kiwanis Park with its 12 acre lake, Scudder Park only a short walk away, and 3 nearby schools making this the place to be! Lots of quality remodels happening in the area, next door is listed at $850k
Home Details
Home Type
- Single Family
Est. Annual Taxes
- $2,620
Year Built
- Built in 1973
Lot Details
- 8,995 Sq Ft Lot
- Desert faces the back of the property
- Block Wall Fence
- Backyard Sprinklers
- Grass Covered Lot
Parking
- 2 Car Garage
Home Design
- Composition Roof
- Block Exterior
Interior Spaces
- 2,050 Sq Ft Home
- 1-Story Property
Flooring
- Carpet
- Tile
Bedrooms and Bathrooms
- 5 Bedrooms
- Primary Bathroom is a Full Bathroom
- 2 Bathrooms
- Double Vanity
Laundry
- Laundry in unit
- Gas Dryer Hookup
Outdoor Features
- Covered Patio or Porch
- Shed
Schools
- Rover Elementary School
- FEES College Preparatory Middle School
- Marcos De Niza High School
Utilities
- Central Air
- Heating System Uses Natural Gas
- High Speed Internet
Additional Features
- No Interior Steps
- North or South Exposure
Community Details
- No Home Owners Association
- Association fees include no fees
- Built by Suggs
- Tempe Royal Palms Subdivision
Listing and Financial Details
- Tax Lot 511
- Assessor Parcel Number 301-91-148
Map
Home Values in the Area
Average Home Value in this Area
Tax History
| Year | Tax Paid | Tax Assessment Tax Assessment Total Assessment is a certain percentage of the fair market value that is determined by local assessors to be the total taxable value of land and additions on the property. | Land | Improvement |
|---|---|---|---|---|
| 2025 | $2,821 | $27,054 | -- | -- |
| 2024 | $2,588 | $25,766 | -- | -- |
| 2023 | $2,588 | $40,000 | $8,000 | $32,000 |
| 2022 | $2,471 | $31,320 | $6,260 | $25,060 |
| 2021 | $2,520 | $29,310 | $5,860 | $23,450 |
| 2020 | $2,437 | $26,720 | $5,340 | $21,380 |
| 2019 | $2,390 | $24,580 | $4,910 | $19,670 |
| 2018 | $2,325 | $22,850 | $4,570 | $18,280 |
| 2017 | $2,253 | $22,100 | $4,420 | $17,680 |
| 2016 | $2,242 | $22,720 | $4,540 | $18,180 |
| 2015 | $2,169 | $20,560 | $4,110 | $16,450 |
Property History
| Date | Event | Price | List to Sale | Price per Sq Ft |
|---|---|---|---|---|
| 01/24/2026 01/24/26 | Price Changed | $615,000 | -1.6% | $300 / Sq Ft |
| 12/23/2025 12/23/25 | Price Changed | $625,000 | -2.2% | $305 / Sq Ft |
| 11/29/2025 11/29/25 | For Sale | $639,000 | -- | $312 / Sq Ft |
Purchase History
| Date | Type | Sale Price | Title Company |
|---|---|---|---|
| Warranty Deed | $140,000 | Security Title Agency | |
| Warranty Deed | $140,000 | Security Title Agency | |
| Interfamily Deed Transfer | -- | Security Title Agency | |
| Interfamily Deed Transfer | -- | Security Title Agency | |
| Interfamily Deed Transfer | -- | -- | |
| Quit Claim Deed | -- | -- |
Mortgage History
| Date | Status | Loan Amount | Loan Type |
|---|---|---|---|
| Open | $82,000 | New Conventional |
Source: Arizona Regional Multiple Listing Service (ARMLS)
MLS Number: 6948742
APN: 301-91-148
Disclaimer: Certain information contained herein is derived from information provided by parties other than Homes.com. All information provided is deemed reliable, but is not guaranteed to be accurate and should be independently verified.
![]() All information should be verified by the recipient and none is guaranteed as accurate by ARMLS
All information should be verified by the recipient and none is guaranteed as accurate by ARMLS
Listing Information presented by local MLS brokerage: Ten-X, local REALTOR®- Arlene Richardson - (888)-952-6393
- 1023 E Watson Dr
- 1003 E Watson Dr
- 1112 E Westchester Dr
- 5802 S Stanley Place
- 949 E Gemini Dr
- 5625 S Admiralty Ct Unit C
- 941 E Libra Dr
- 953 E Libra Dr
- 942 E Driftwood Dr
- 959 E Lobster Trap Ln
- 938 E Driftwood Dr
- 520 E Watson Dr
- 1124 E Driftwood Dr
- 1134 E Driftwood Dr
- 727 E Auburn Dr
- 414 E Westchester Dr
- 5824 S College Ave
- 6204 S College Ave
- 5627 S Crows Nest Rd
- 1402 E Guadalupe Rd Unit 153
- 1104 E Watson Dr
- 5807 S Palm Dr
- 514 E Westchester Dr
- 1149 E Sandpiper Dr Unit 214
- 6503 S Bonarden Ln
- 1402 E Guadalupe Rd Unit 119
- 999 E Baseline Dr
- 804 E Carmen St
- 995 E Baseline Rd
- 5200 S Lakeshore Dr Unit 128
- 6737 S Patty Ln
- 1607 E Libra Dr
- 1511 E Edgewater Dr
- 4690 S Lakeshore Dr
- 6836 S Terrace Rd
- 5132 S Dorsey Ln Unit A
- 5132 S Dorsey Ln
- 1514 E Weathervane Ln
- 4630 S Lakeshore Dr
- 1161 E Diamond Dr

Ask me questions while you tour the home.