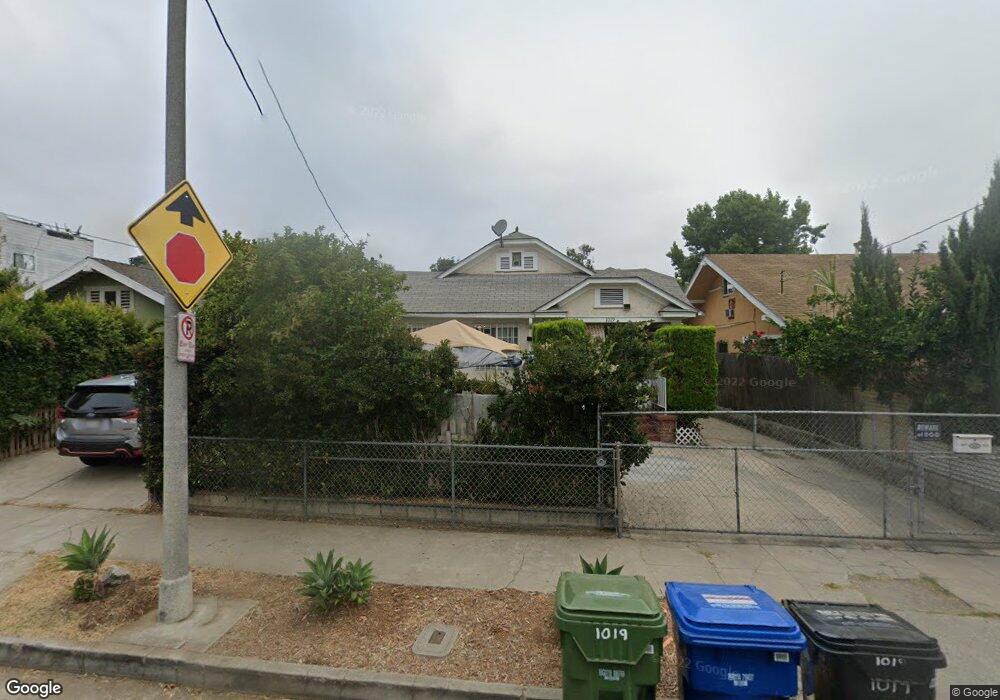
1019 N Rampart Blvd Los Angeles, CA 90026
Echo Park NeighborhoodEstimated Value: $1,301,417 - $1,845,000
4
Beds
2
Baths
1,801
Sq Ft
$851/Sq Ft
Est. Value
About This Home
This home is located at 1019 N Rampart Blvd, Los Angeles, CA 90026 and is currently estimated at $1,532,604, approximately $850 per square foot. 1019 N Rampart Blvd is a home located in Los Angeles County with nearby schools including Micheltorena Street Elementary School, Thomas Starr King Middle School Film and Media Magnet, and John Marshall Senior High.
Ownership History
Date
Name
Owned For
Owner Type
Purchase Details
Closed on
Sep 15, 2020
Sold by
Madarang Domingo
Bought by
Madarang Domingo
Current Estimated Value
Purchase Details
Closed on
Jan 29, 1998
Sold by
Senga Albin
Bought by
Senga Chona M
Home Financials for this Owner
Home Financials are based on the most recent Mortgage that was taken out on this home.
Original Mortgage
$118,400
Outstanding Balance
$20,204
Interest Rate
6.95%
Estimated Equity
$1,512,400
Purchase Details
Closed on
Dec 26, 1997
Sold by
Southern Pacific Thrift & Loan Assn
Bought by
Senga Chona M and Madarang Domingo G
Home Financials for this Owner
Home Financials are based on the most recent Mortgage that was taken out on this home.
Original Mortgage
$118,400
Outstanding Balance
$20,204
Interest Rate
6.95%
Estimated Equity
$1,512,400
Purchase Details
Closed on
Oct 13, 1997
Sold by
Quinto Reynaldo Y and Southern Pacific Thrift & Loan
Bought by
Southern Pacific Thrift & Loan Assn
Create a Home Valuation Report for This Property
The Home Valuation Report is an in-depth analysis detailing your home's value as well as a comparison with similar homes in the area
Home Values in the Area
Average Home Value in this Area
Purchase History
| Date | Buyer | Sale Price | Title Company |
|---|---|---|---|
| Madarang Domingo | -- | None Available | |
| Senga Chona M | -- | Fidelity National Title Co | |
| Senga Chona M | $148,000 | Fidelity National Title Co | |
| Southern Pacific Thrift & Loan Assn | $165,849 | Fidelity National Title Ins |
Source: Public Records
Mortgage History
| Date | Status | Borrower | Loan Amount |
|---|---|---|---|
| Open | Senga Chona M | $118,400 |
Source: Public Records
Tax History Compared to Growth
Tax History
| Year | Tax Paid | Tax Assessment Tax Assessment Total Assessment is a certain percentage of the fair market value that is determined by local assessors to be the total taxable value of land and additions on the property. | Land | Improvement |
|---|---|---|---|---|
| 2025 | $3,090 | $236,291 | $189,041 | $47,250 |
| 2024 | $3,090 | $231,659 | $185,335 | $46,324 |
| 2023 | $3,035 | $227,117 | $181,701 | $45,416 |
| 2022 | $2,900 | $222,665 | $178,139 | $44,526 |
| 2021 | $2,856 | $218,300 | $174,647 | $43,653 |
| 2020 | $2,880 | $216,063 | $172,857 | $43,206 |
| 2019 | $2,775 | $211,827 | $169,468 | $42,359 |
| 2018 | $2,703 | $207,675 | $166,146 | $41,529 |
| 2016 | $2,568 | $199,613 | $159,696 | $39,917 |
| 2015 | $2,532 | $196,616 | $157,298 | $39,318 |
| 2014 | $2,548 | $192,765 | $154,217 | $38,548 |
Source: Public Records
Map
Nearby Homes
- 851 N Rampart Blvd
- 921 N Benton Way
- 444 N Coronado St
- 2506 W Sunset Blvd
- 727 N La Fayette Park Place
- 706 N Occidental Blvd
- 860 N Occidental Blvd
- 1114 Coronado Terrace
- 608 N Rampart Blvd
- 1037 Waterloo St
- 627 Coronado Terrace
- 1310 N Occidental Blvd
- 1315 Coronado Terrace
- 901 Rosemont Ave
- 720 Waterloo St Unit 4
- 1315 Silver Lake Blvd
- 660 Silver Lake Blvd
- 665 Silver Lake Blvd
- 2949 London St
- 802 N Dillon St
- 1015 N Rampart Blvd
- 1023 N Rampart Blvd
- 1011 N Rampart Blvd
- 1027 N Rampart Blvd
- 1031 N Rampart Blvd
- 1007 N Rampart Blvd
- 920 N Benton Way
- 930 N Benton Way
- 912 N Benton Way
- 1035 N Rampart Blvd
- 1018 N Rampart Blvd
- 2611 Marathon St
- 1014 N Rampart Blvd
- 1001 N Rampart Blvd
- 2609 Marathon St
- 1022 N Rampart Blvd
- 934 N Benton Way
- 1010 N Rampart Blvd Unit Back
- 1010 N Rampart Blvd
- 910 N Benton Way