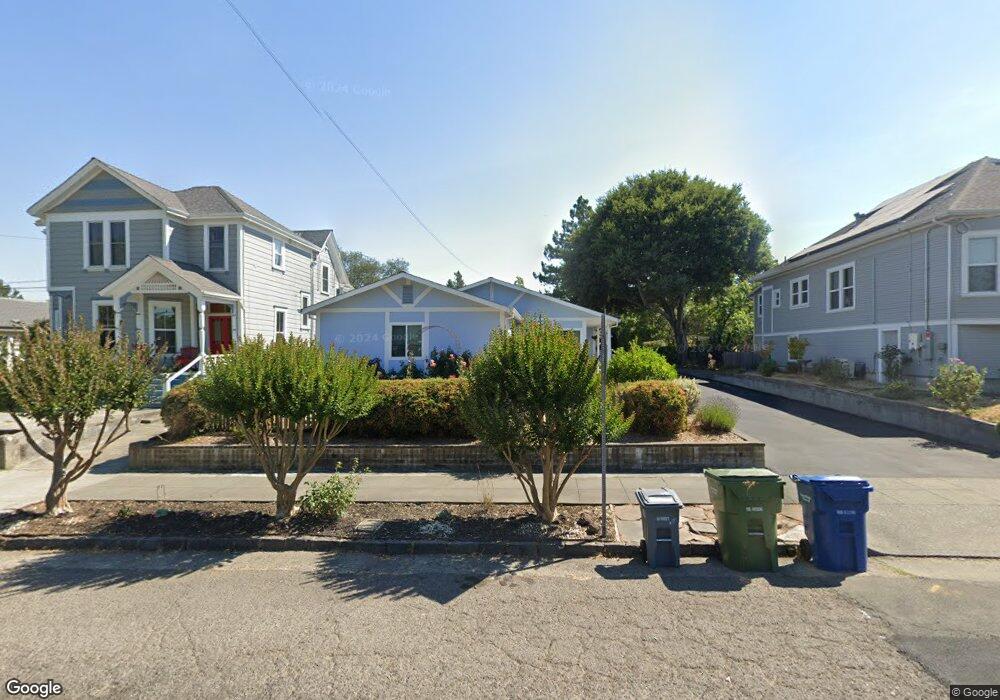
102 8th St Petaluma, CA 94952
Western Petaluma NeighborhoodEstimated Value: $864,000 - $1,005,000
3
Beds
2
Baths
1,234
Sq Ft
$762/Sq Ft
Est. Value
About This Home
This home is located at 102 8th St, Petaluma, CA 94952 and is currently estimated at $940,824, approximately $762 per square foot. 102 8th St is a home located in Sonoma County with nearby schools including McNear Elementary School, Petaluma Junior High School, and Petaluma High School.
Ownership History
Date
Name
Owned For
Owner Type
Purchase Details
Closed on
Feb 19, 2016
Sold by
Lahti James M and The Lahti Family Living Trust
Bought by
Akhurst Robin F and Akhurst Aneeta
Current Estimated Value
Home Financials for this Owner
Home Financials are based on the most recent Mortgage that was taken out on this home.
Original Mortgage
$457,400
Outstanding Balance
$364,868
Interest Rate
3.97%
Mortgage Type
New Conventional
Estimated Equity
$575,956
Purchase Details
Closed on
Jul 17, 2000
Sold by
Lahti Thelma and Lahti Family Trust
Bought by
Lahti Thelma and Walter E Lahti Disclaimer Trus
Create a Home Valuation Report for This Property
The Home Valuation Report is an in-depth analysis detailing your home's value as well as a comparison with similar homes in the area
Home Values in the Area
Average Home Value in this Area
Purchase History
| Date | Buyer | Sale Price | Title Company |
|---|---|---|---|
| Akhurst Robin F | $525,000 | First American Title Company | |
| Lahti Thelma | -- | -- |
Source: Public Records
Mortgage History
| Date | Status | Borrower | Loan Amount |
|---|---|---|---|
| Open | Akhurst Robin F | $457,400 |
Source: Public Records
Tax History
| Year | Tax Paid | Tax Assessment Tax Assessment Total Assessment is a certain percentage of the fair market value that is determined by local assessors to be the total taxable value of land and additions on the property. | Land | Improvement |
|---|---|---|---|---|
| 2025 | $6,689 | $621,486 | $248,594 | $372,892 |
| 2024 | $6,689 | $609,301 | $243,720 | $365,581 |
| 2023 | $6,689 | $597,355 | $238,942 | $358,413 |
| 2022 | $6,465 | $585,643 | $234,257 | $351,386 |
| 2021 | $6,342 | $574,161 | $229,664 | $344,497 |
| 2020 | $6,396 | $568,275 | $227,310 | $340,965 |
| 2019 | $6,316 | $557,133 | $222,853 | $334,280 |
| 2018 | $6,291 | $546,210 | $218,484 | $327,726 |
| 2017 | $6,158 | $535,500 | $214,200 | $321,300 |
| 2016 | $1,715 | $146,132 | $64,750 | $81,382 |
| 2015 | $1,566 | $143,938 | $63,778 | $80,160 |
| 2014 | $1,557 | $141,119 | $62,529 | $78,590 |
Source: Public Records
Map
Nearby Homes
- 16 7th St
- 11 10th St
- 618 E St
- 1309 D Street Extension
- 100 Orchard Ln
- 131 Liberty St
- 136 Court St
- 105 G St
- 720 Petaluma Blvd S Unit 28
- 21 Branching Way
- 1170 I St
- 0 Lakeville St
- 22 Oak Knoll Ct
- 512 Kentucky St
- 1021 Mcnear Ave
- 320 Vallejo St
- 316 Vallejo St
- 591 Madison St
- 13 Dorenfeld Ct
- 12 Dorenfeld Ct
Your Personal Tour Guide
Ask me questions while you tour the home.