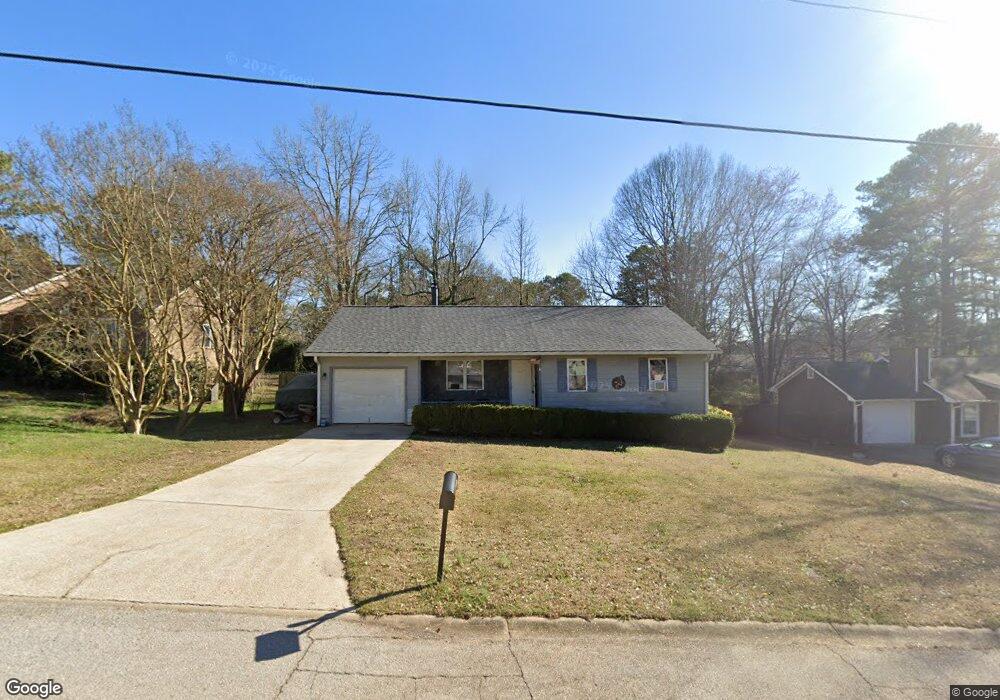
102 Clifford Ct Stockbridge, GA 30281
Estimated Value: $208,000 - $229,000
3
Beds
2
Baths
1,174
Sq Ft
$184/Sq Ft
Est. Value
About This Home
This home is located at 102 Clifford Ct, Stockbridge, GA 30281 and is currently estimated at $216,283, approximately $184 per square foot. 102 Clifford Ct is a home located in Henry County with nearby schools including Stockbridge Elementary School, Smith-Barnes Elementary School, and Stockbridge Middle School.
Ownership History
Date
Name
Owned For
Owner Type
Purchase Details
Closed on
May 2, 2008
Sold by
Hsbc Mortgage Svcs Inc
Bought by
Sysk Jason T and Sysk April D
Current Estimated Value
Home Financials for this Owner
Home Financials are based on the most recent Mortgage that was taken out on this home.
Original Mortgage
$64,980
Outstanding Balance
$40,839
Interest Rate
5.82%
Mortgage Type
FHA
Estimated Equity
$175,444
Purchase Details
Closed on
Jan 2, 2008
Sold by
Blackwell Fatima
Bought by
Hsbc Mtg Svcs Inc
Purchase Details
Closed on
Oct 12, 2000
Sold by
Caldwell-Taylor Leslie E
Bought by
Blackwell Fatima
Home Financials for this Owner
Home Financials are based on the most recent Mortgage that was taken out on this home.
Original Mortgage
$82,222
Interest Rate
7.96%
Mortgage Type
FHA
Purchase Details
Closed on
Jan 29, 1996
Sold by
George Clavin F and Powell Theresa A
Bought by
Caldwell Leslie E
Create a Home Valuation Report for This Property
The Home Valuation Report is an in-depth analysis detailing your home's value as well as a comparison with similar homes in the area
Home Values in the Area
Average Home Value in this Area
Purchase History
| Date | Buyer | Sale Price | Title Company |
|---|---|---|---|
| Sysk Jason T | $66,000 | -- | |
| Hsbc Mtg Svcs Inc | $69,000 | -- | |
| Blackwell Fatima | $82,900 | -- | |
| Caldwell Leslie E | $68,000 | -- |
Source: Public Records
Mortgage History
| Date | Status | Borrower | Loan Amount |
|---|---|---|---|
| Open | Sysk Jason T | $64,980 | |
| Previous Owner | Blackwell Fatima | $82,222 | |
| Closed | Caldwell Leslie E | $0 |
Source: Public Records
Tax History Compared to Growth
Tax History
| Year | Tax Paid | Tax Assessment Tax Assessment Total Assessment is a certain percentage of the fair market value that is determined by local assessors to be the total taxable value of land and additions on the property. | Land | Improvement |
|---|---|---|---|---|
| 2025 | $2,683 | $81,880 | $14,000 | $67,880 |
| 2024 | $2,683 | $79,720 | $14,000 | $65,720 |
| 2023 | $2,086 | $75,680 | $10,000 | $65,680 |
| 2022 | $1,862 | $63,960 | $10,000 | $53,960 |
| 2021 | $1,519 | $49,440 | $10,000 | $39,440 |
| 2020 | $1,441 | $46,160 | $8,000 | $38,160 |
| 2019 | $1,393 | $44,120 | $8,000 | $36,120 |
| 2018 | $1,095 | $34,560 | $8,000 | $26,560 |
| 2016 | $921 | $30,040 | $6,000 | $24,040 |
| 2015 | $666 | $23,120 | $6,000 | $17,120 |
| 2014 | $637 | $22,280 | $4,000 | $18,280 |
Source: Public Records
Map
Nearby Homes
- 164 Adrian Dr
- 0 Hwy 138 Unit 7635399
- 0 Hwy 138 Unit 13974666
- 0 Hwy 138 Unit 10587482
- 124 Meadow Ridge Dr Unit I
- 120 Mossy Brook Dr
- 173 Brush Creek Ct
- 236 Hillandale Dr
- 185 Brush Creek Ct
- 189 Brush Creek Ct
- 193 Brush Creek Ct
- 197 Brush Creek Ct
- 201 Brush Creek Ct
- 225 Hillandale Dr
- 515 Valley Hill Rd
- 101 Valleydale Dr
- 813 Abarca Ln
- 809 Abarca Ln
- 805 Abarca Ln
- 101 Bridge Park Ct
- 104 Clifford Ct Unit 104
- 104 Clifford Ct
- 104 Clifford Ct
- 100 Clifford Ct
- 106 Clifford Ct
- 106 Clifford Ct Unit 13
- 712 Davis Rd
- 102 Adrian Dr
- 714 Davis Rd
- 103 Clifford Ct
- 108 Clifford Ct
- 716 Davis Rd
- 105 Clifford Ct
- 103 Adrian Dr
- 110 Adrian Dr
- 107 Adrian Dr
- 107 Clifford Ct
- 101 Adrian Dr
- 110 Clifford Ct
- 718 Davis Rd