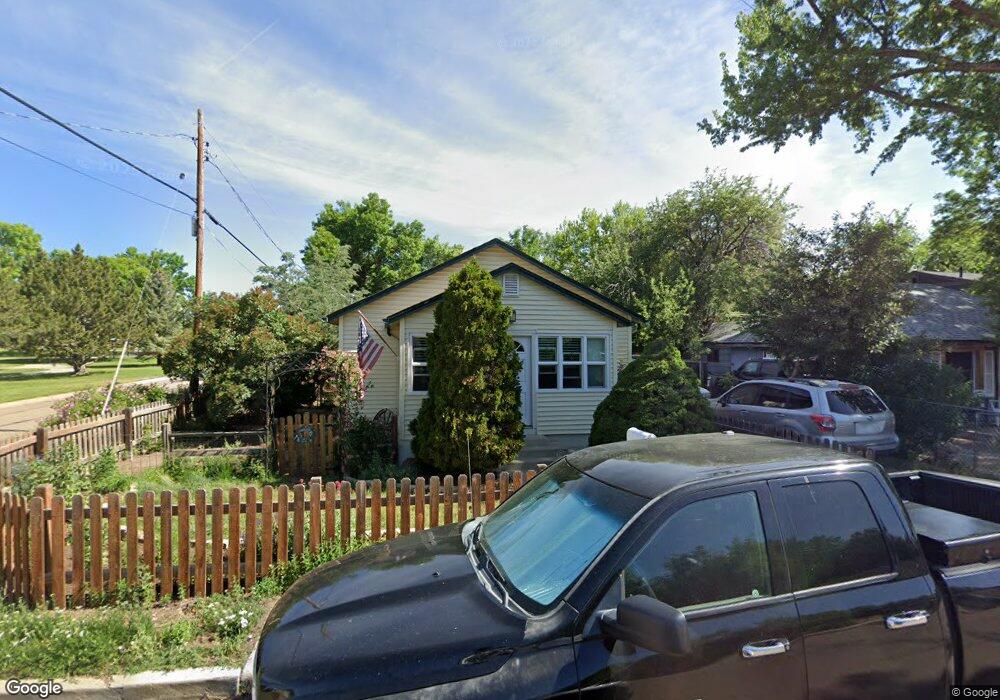
102 E Saint Clair Ave Longmont, CO 80504
Kensington NeighborhoodEstimated Value: $309,000 - $383,000
2
Beds
1
Bath
624
Sq Ft
$533/Sq Ft
Est. Value
About This Home
This home is located at 102 E Saint Clair Ave, Longmont, CO 80504 and is currently estimated at $332,440, approximately $532 per square foot. 102 E Saint Clair Ave is a home located in Boulder County with nearby schools including Columbine Elementary School, Trail Ridge Middle School, and Skyline High School.
Ownership History
Date
Name
Owned For
Owner Type
Purchase Details
Closed on
Jan 25, 2002
Sold by
Reed Jana D and Trofi Michael A
Bought by
Froonjian Denise
Current Estimated Value
Home Financials for this Owner
Home Financials are based on the most recent Mortgage that was taken out on this home.
Original Mortgage
$105,290
Outstanding Balance
$43,813
Interest Rate
7.15%
Estimated Equity
$288,627
Purchase Details
Closed on
Feb 26, 1999
Sold by
Djay Peter
Bought by
Trofi Michael A
Home Financials for this Owner
Home Financials are based on the most recent Mortgage that was taken out on this home.
Original Mortgage
$76,000
Interest Rate
6.73%
Purchase Details
Closed on
Aug 28, 1998
Sold by
Weber Dennis L and Weber Patricia A
Bought by
Djay Peter
Purchase Details
Closed on
Feb 17, 1981
Bought by
Froonjian Denise
Create a Home Valuation Report for This Property
The Home Valuation Report is an in-depth analysis detailing your home's value as well as a comparison with similar homes in the area
Home Values in the Area
Average Home Value in this Area
Purchase History
| Date | Buyer | Sale Price | Title Company |
|---|---|---|---|
| Froonjian Denise | $108,000 | -- | |
| Trofi Michael A | $95,000 | -- | |
| Djay Peter | -- | -- | |
| Froonjian Denise | $3,000 | -- | |
| Froonjian Denise | $25,800 | -- |
Source: Public Records
Mortgage History
| Date | Status | Borrower | Loan Amount |
|---|---|---|---|
| Open | Froonjian Denise | $105,290 | |
| Previous Owner | Trofi Michael A | $76,000 |
Source: Public Records
Tax History
| Year | Tax Paid | Tax Assessment Tax Assessment Total Assessment is a certain percentage of the fair market value that is determined by local assessors to be the total taxable value of land and additions on the property. | Land | Improvement |
|---|---|---|---|---|
| 2025 | $1,724 | $19,288 | $7,225 | $12,063 |
| 2024 | $1,724 | $19,288 | $7,225 | $12,063 |
| 2023 | $1,700 | $18,023 | $7,879 | $13,829 |
| 2022 | $1,684 | $17,014 | $5,720 | $11,294 |
| 2021 | $1,705 | $17,503 | $5,884 | $11,619 |
| 2020 | $1,397 | $14,379 | $5,720 | $8,659 |
| 2019 | $1,375 | $14,379 | $5,720 | $8,659 |
| 2018 | $1,101 | $11,592 | $4,896 | $6,696 |
| 2017 | $1,086 | $12,816 | $5,413 | $7,403 |
| 2016 | $923 | $9,655 | $5,094 | $4,561 |
| 2015 | $879 | $8,182 | $2,706 | $5,476 |
| 2014 | $764 | $8,182 | $2,706 | $5,476 |
Source: Public Records
Map
Nearby Homes
- 225 E 8th Ave Unit E20
- 225 E 8th Ave Unit F2
- 225 E 8th Ave Unit C14
- 128 E 5th Ave
- 136 E 5th Ave
- 140 E 5th Ave
- 29 Marshall Place
- 500 Lashley St Unit 48
- 244 Sorento Place
- 830 Martin St
- 262 E 5th Ave
- 36 Reed Place
- 815 Hilltop St
- 845 Martin St
- 240 Wadsworth Cir
- 536 Atwood St
- 104 Rothrock Place
- 10 9th Ave Unit 18
- 422 Atwood St
- 145 Placer Ave
- 106 E Saint Clair Ave
- 110 E Saint Clair Ave
- 664 Kensington St
- 107 E Longs Peak Ave
- 103 E Saint Clair Ave
- 118 E Saint Clair Ave
- 109 E Saint Clair Ave
- 115 E Longs Peak Ave
- 122 E Saint Clair Ave
- 123 E Longs Peak Ave
- 126 E Saint Clair Ave
- 120 E Longs Peak Ave
- 130 E Saint Clair Ave
- 127 E Saint Clair Ave
- 116 E 6th Ave
- 129 E Longs Peak Ave
- 707 Rees Ct
- 129 E Longs Peak Ave
- 122 E Longs Peak Ave
- 120 E 6th Ave
Your Personal Tour Guide
Ask me questions while you tour the home.