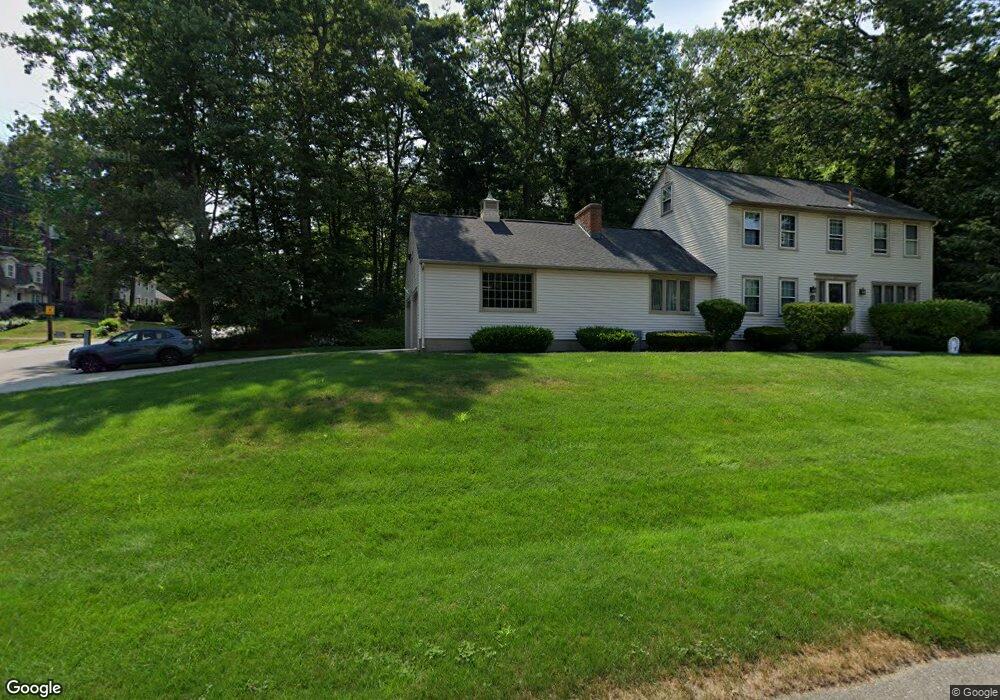
102 Fawn Ln Nashua, NH 03064
Northeast Nashua NeighborhoodEstimated Value: $651,348 - $697,000
4
Beds
3
Baths
2,044
Sq Ft
$326/Sq Ft
Est. Value
About This Home
This home is located at 102 Fawn Ln, Nashua, NH 03064 and is currently estimated at $667,087, approximately $326 per square foot. 102 Fawn Ln is a home located in Hillsborough County with nearby schools including Charlotte Ave Elementary School, Pennichuck Middle School, and Nashua High School North.
Ownership History
Date
Name
Owned For
Owner Type
Purchase Details
Closed on
Jan 23, 2019
Sold by
Ehab & Frances Morcos Ft and Morcos
Bought by
Morcos Ehab S and Morcos Frances A
Current Estimated Value
Home Financials for this Owner
Home Financials are based on the most recent Mortgage that was taken out on this home.
Original Mortgage
$279,000
Outstanding Balance
$174,765
Interest Rate
4.5%
Mortgage Type
New Conventional
Estimated Equity
$492,322
Purchase Details
Closed on
Oct 5, 2016
Sold by
Morcos Ehab and Morcos Frances A
Bought by
Ehab & Francs Morcos Ft and Morcos
Purchase Details
Closed on
Nov 3, 2009
Sold by
Haig Dermanoogian Ret and Dermanoogian Verna M
Bought by
Morcos Ehab S and Morcos Frances A
Home Financials for this Owner
Home Financials are based on the most recent Mortgage that was taken out on this home.
Original Mortgage
$314,204
Interest Rate
5.06%
Mortgage Type
Purchase Money Mortgage
Create a Home Valuation Report for This Property
The Home Valuation Report is an in-depth analysis detailing your home's value as well as a comparison with similar homes in the area
Home Values in the Area
Average Home Value in this Area
Purchase History
| Date | Buyer | Sale Price | Title Company |
|---|---|---|---|
| Morcos Ehab S | -- | -- | |
| Ehab & Francs Morcos Ft | -- | -- | |
| Morcos Ehab S | $320,000 | -- |
Source: Public Records
Mortgage History
| Date | Status | Borrower | Loan Amount |
|---|---|---|---|
| Open | Morcos Ehab S | $279,000 | |
| Previous Owner | Morcos Ehab S | $34,972 | |
| Previous Owner | Morcos Ehab S | $314,204 |
Source: Public Records
Tax History Compared to Growth
Tax History
| Year | Tax Paid | Tax Assessment Tax Assessment Total Assessment is a certain percentage of the fair market value that is determined by local assessors to be the total taxable value of land and additions on the property. | Land | Improvement |
|---|---|---|---|---|
| 2024 | $8,715 | $548,100 | $179,100 | $369,000 |
| 2023 | $8,165 | $447,900 | $143,300 | $304,600 |
| 2022 | $8,094 | $447,900 | $143,300 | $304,600 |
| 2021 | $7,254 | $312,400 | $100,200 | $212,200 |
| 2020 | $7,016 | $310,300 | $100,200 | $210,100 |
| 2019 | $6,752 | $310,300 | $100,200 | $210,100 |
| 2018 | $6,581 | $310,300 | $100,200 | $210,100 |
| 2017 | $7,005 | $271,600 | $86,000 | $185,600 |
| 2016 | $6,809 | $271,600 | $86,000 | $185,600 |
| 2015 | $6,662 | $271,600 | $86,000 | $185,600 |
| 2014 | $6,532 | $271,600 | $86,000 | $185,600 |
Source: Public Records
Map
Nearby Homes
- 33 Ferry Rd
- 30 Burgess St
- 74 Profile Cir
- 123 Cannongate III
- 17 Danbury Rd
- 3 Wright Rd
- 9 Elystan Cir
- 31 Ashland St
- 7 Robert Dr
- 3 Opal Way Unit 3
- 1 Opal Way Unit 1
- 2 Opal Way Unit 2
- 12 Juliana Ave Unit 14
- 31 Juliana Ave
- 31 Juliana Ave Unit 4
- 11 Juliana Ave Unit 52
- 19 Dunloggin Rd
- 44 Broad St
- 40 Merrimack Dr
- 11 Amherst Terrace