Estimated Value: $128,000 - $197,000
2
Beds
1
Bath
960
Sq Ft
$158/Sq Ft
Est. Value
About This Home
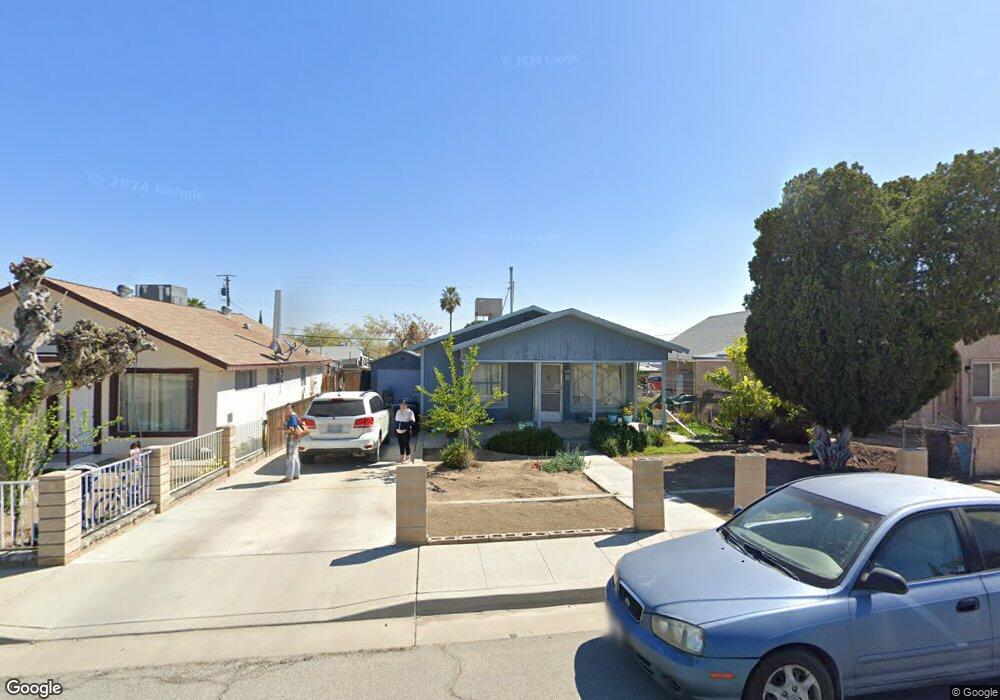
This home is located at 102 Fillmore St, Taft, CA 93268 and is currently estimated at $151,737, approximately $158 per square foot. 102 Fillmore St is a home located in Kern County with nearby schools including Jefferson Elementary School, Roosevelt Elementary School, and Lincoln Junior High School.
Ownership History
Date
Name
Owned For
Owner Type
Purchase Details
Closed on
Jun 15, 2010
Sold by
Romero Jennifer Ann
Bought by
Romero Cesar
Current Estimated Value
Purchase Details
Closed on
Jun 14, 2010
Sold by
Morales Uriel and Morales Sonia
Bought by
Romero Cesar
Purchase Details
Closed on
Oct 16, 2006
Sold by
Kitchen Linda J and The John W Wayne Living Trust
Bought by
Morales Uriel and Morales Sonia
Home Financials for this Owner
Home Financials are based on the most recent Mortgage that was taken out on this home.
Original Mortgage
$105,600
Interest Rate
6.85%
Mortgage Type
Purchase Money Mortgage
Purchase Details
Closed on
Jan 27, 2005
Sold by
Sweeney Audrey E
Bought by
Kitchen Linda J
Purchase Details
Closed on
Jun 12, 1997
Sold by
Wayne John W
Bought by
Wayne John W and John W Wayne Living Trust
Create a Home Valuation Report for This Property
The Home Valuation Report is an in-depth analysis detailing your home's value as well as a comparison with similar homes in the area
Home Values in the Area
Average Home Value in this Area
Purchase History
| Date | Buyer | Sale Price | Title Company |
|---|---|---|---|
| Romero Cesar | -- | First American Title Company | |
| Romero Cesar | $35,000 | First American Title Company | |
| Morales Uriel | $132,000 | First American Title Company | |
| Kitchen Linda J | -- | -- | |
| Wayne John W | -- | -- |
Source: Public Records
Mortgage History
| Date | Status | Borrower | Loan Amount |
|---|---|---|---|
| Previous Owner | Morales Uriel | $105,600 |
Source: Public Records
Tax History
| Year | Tax Paid | Tax Assessment Tax Assessment Total Assessment is a certain percentage of the fair market value that is determined by local assessors to be the total taxable value of land and additions on the property. | Land | Improvement |
|---|---|---|---|---|
| 2025 | $1,699 | $45,162 | $23,226 | $21,936 |
| 2024 | $1,506 | $44,277 | $22,771 | $21,506 |
| 2023 | $1,506 | $43,410 | $22,325 | $21,085 |
| 2022 | $1,333 | $42,560 | $21,888 | $20,672 |
| 2021 | $1,227 | $41,726 | $21,459 | $20,267 |
| 2020 | $1,125 | $41,299 | $21,239 | $20,060 |
| 2019 | $1,099 | $41,299 | $21,239 | $20,060 |
| 2018 | $1,060 | $39,697 | $20,415 | $19,282 |
| 2017 | $1,044 | $38,919 | $20,015 | $18,904 |
| 2016 | $1,036 | $38,157 | $19,623 | $18,534 |
| 2015 | $969 | $37,585 | $19,329 | $18,256 |
| 2014 | $892 | $35,000 | $8,750 | $26,250 |
Source: Public Records
Map
Nearby Homes
Your Personal Tour Guide
Ask me questions while you tour the home.