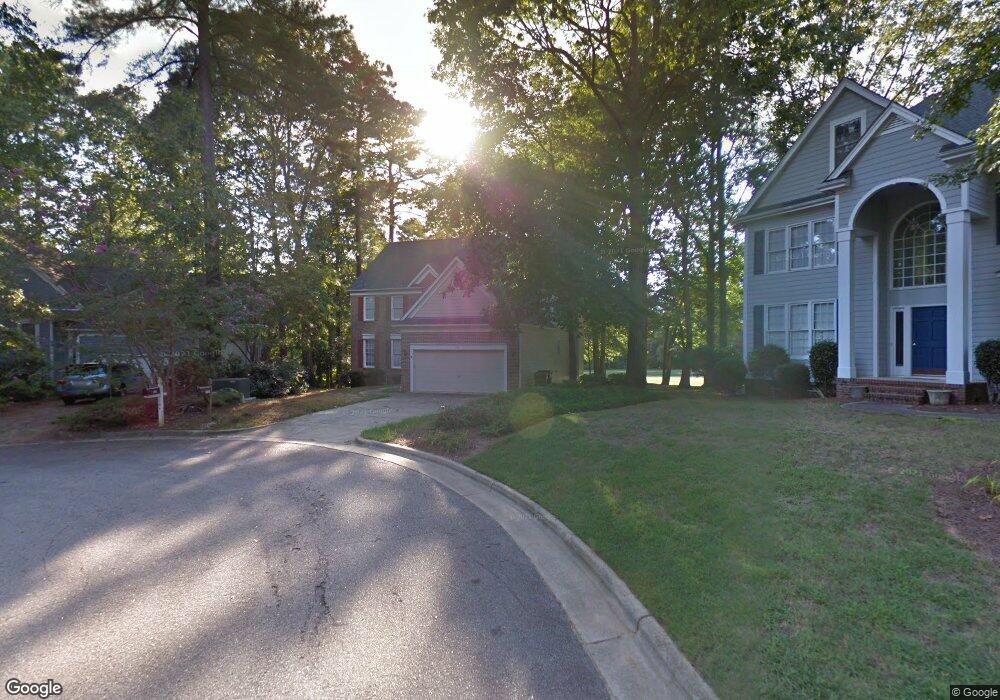
102 Flemington Ct Cary, NC 27518
Crossroads NeighborhoodEstimated Value: $546,473 - $613,000
4
Beds
3
Baths
2,536
Sq Ft
$227/Sq Ft
Est. Value
About This Home
This home is located at 102 Flemington Ct, Cary, NC 27518 and is currently estimated at $575,368, approximately $226 per square foot. 102 Flemington Ct is a home located in Wake County with nearby schools including Dillard Drive Magnet Elementary School, Dillard Drive Magnet Middle School, and Resurrection Lutheran School.
Ownership History
Date
Name
Owned For
Owner Type
Purchase Details
Closed on
Mar 17, 2021
Sold by
Green William Jacob and Green Lauren Ciccarello
Bought by
Green William Jacob and Ciccarello Lauren
Current Estimated Value
Home Financials for this Owner
Home Financials are based on the most recent Mortgage that was taken out on this home.
Original Mortgage
$275,100
Outstanding Balance
$247,435
Interest Rate
2.9%
Mortgage Type
New Conventional
Estimated Equity
$327,933
Purchase Details
Closed on
Oct 18, 2018
Sold by
Lavalle Nick A and Lavalle Margaret M
Bought by
Green William Jacob and Ciccarello Lauren
Home Financials for this Owner
Home Financials are based on the most recent Mortgage that was taken out on this home.
Original Mortgage
$276,000
Interest Rate
4.5%
Mortgage Type
New Conventional
Purchase Details
Closed on
Mar 19, 1993
Bought by
Lavalle Nick A and Lavalle Margaret M
Create a Home Valuation Report for This Property
The Home Valuation Report is an in-depth analysis detailing your home's value as well as a comparison with similar homes in the area
Home Values in the Area
Average Home Value in this Area
Purchase History
| Date | Buyer | Sale Price | Title Company |
|---|---|---|---|
| Green William Jacob | -- | Timios Inc | |
| Green William Jacob | -- | None Listed On Document | |
| Green William Jacob | $345,000 | None Available | |
| Lavalle Nick A | $171,000 | -- |
Source: Public Records
Mortgage History
| Date | Status | Borrower | Loan Amount |
|---|---|---|---|
| Open | Green William Jacob | $275,100 | |
| Closed | Green William Jacob | $275,100 | |
| Previous Owner | Green William Jacob | $276,000 |
Source: Public Records
Tax History
| Year | Tax Paid | Tax Assessment Tax Assessment Total Assessment is a certain percentage of the fair market value that is determined by local assessors to be the total taxable value of land and additions on the property. | Land | Improvement |
|---|---|---|---|---|
| 2025 | $4,382 | $508,948 | $140,000 | $368,948 |
| 2024 | $4,288 | $508,948 | $140,000 | $368,948 |
| 2023 | $3,527 | $349,996 | $80,000 | $269,996 |
| 2022 | $3,396 | $349,996 | $80,000 | $269,996 |
| 2021 | $3,327 | $349,996 | $80,000 | $269,996 |
| 2020 | $3,345 | $349,996 | $80,000 | $269,996 |
| 2019 | $3,237 | $300,430 | $80,000 | $220,430 |
| 2018 | $3,038 | $300,430 | $80,000 | $220,430 |
| 2017 | $2,919 | $300,430 | $80,000 | $220,430 |
| 2016 | $2,876 | $300,430 | $80,000 | $220,430 |
| 2015 | $2,979 | $300,606 | $80,000 | $220,606 |
| 2014 | $2,810 | $300,606 | $80,000 | $220,606 |
Source: Public Records
Map
Nearby Homes
- 300 W Kirkfield Dr
- 1641 Kildonan Place
- 0 SE Cary Pkwy Unit 2491180
- 6315 Tryon Rd
- 2210 Stephens Rd
- 917 Bentbury Way
- 107 Larkwood Ln
- 106 Brannigan Place
- 116 Barbary Ct
- 1331 Kingston Ridge Rd
- 105 Headlands Ln
- 117 Fox Briar Ln
- 528 Spring Flower Ct
- 404 Greenwood Cir
- 516 Spring Flower Ct
- 102 Shriver Ct
- 512 Spring Flower Ct
- 101 Springbrook Place
- 2004 Clyde Bank Ct Unit 27A
- 111 Bonner Ct
- 104 Flemington Ct
- 100 Flemington Ct
- 201 Duncan Hill Ct
- 203 Duncan Hill Ct
- 106 Flemington Ct
- 105 Flemington Ct
- 205 Duncan Hill Ct
- 107 Flemington Ct
- 103 Flemington Ct
- 200 Duncan Hill Ct
- 4412 Wellington Ridge Loop
- 4412 Wellington Ridge Loop Unit none
- 4423 Wellington Ridge Loop Unit 16
- 4422 Wellington Ridge Loop
- 4421 Wellington Ridge Loop
- 4411 Wellington Ridge Loop
- 101 Flemington Ct
- 207 Duncan Hill Ct
- 4212 Wellington Ridge Loop
- 2222 Wellington Ridge Loop
Your Personal Tour Guide
Ask me questions while you tour the home.