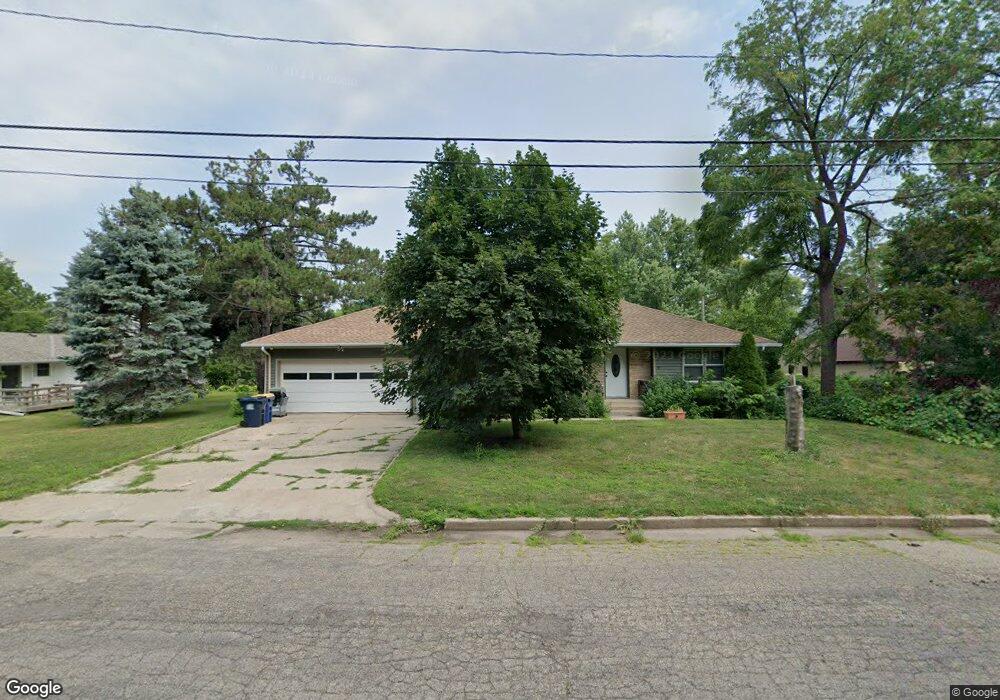
102 Fremont St W Northfield, MN 55057
Estimated Value: $334,000 - $401,000
3
Beds
2
Baths
1,230
Sq Ft
$293/Sq Ft
Est. Value
About This Home
This home is located at 102 Fremont St W, Northfield, MN 55057 and is currently estimated at $360,239, approximately $292 per square foot. 102 Fremont St W is a home located in Rice County with nearby schools including Spring Creek Elementary, Northfield Middle School, and Northfield Senior High School.
Ownership History
Date
Name
Owned For
Owner Type
Purchase Details
Closed on
Aug 23, 2024
Sold by
Schmidt Gary
Bought by
Huynh Do
Current Estimated Value
Home Financials for this Owner
Home Financials are based on the most recent Mortgage that was taken out on this home.
Original Mortgage
$220,000
Outstanding Balance
$217,520
Interest Rate
6.89%
Mortgage Type
New Conventional
Estimated Equity
$142,719
Purchase Details
Closed on
Jul 1, 2016
Sold by
Reenergize Properties Inc
Bought by
Schmidt Gary L and Schmidt Tammy
Home Financials for this Owner
Home Financials are based on the most recent Mortgage that was taken out on this home.
Original Mortgage
$211,105
Interest Rate
3.66%
Mortgage Type
FHA
Purchase Details
Closed on
Oct 12, 2015
Sold by
Morrison Scott Scott
Home Financials for this Owner
Home Financials are based on the most recent Mortgage that was taken out on this home.
Original Mortgage
$62,000
Interest Rate
3.76%
Purchase Details
Closed on
Dec 22, 2008
Sold by
Not Provided
Bought by
Morrison Scott A
Create a Home Valuation Report for This Property
The Home Valuation Report is an in-depth analysis detailing your home's value as well as a comparison with similar homes in the area
Home Values in the Area
Average Home Value in this Area
Purchase History
| Date | Buyer | Sale Price | Title Company |
|---|---|---|---|
| Huynh Do | $220,000 | -- | |
| Schmidt Gary L | $215,000 | Trademark Title Services Inc | |
| -- | $85,000 | -- | |
| Morrison Scott A | $58,725 | -- |
Source: Public Records
Mortgage History
| Date | Status | Borrower | Loan Amount |
|---|---|---|---|
| Open | Huynh Do | $220,000 | |
| Previous Owner | Schmidt Gary L | $211,105 | |
| Previous Owner | -- | $62,000 |
Source: Public Records
Tax History Compared to Growth
Tax History
| Year | Tax Paid | Tax Assessment Tax Assessment Total Assessment is a certain percentage of the fair market value that is determined by local assessors to be the total taxable value of land and additions on the property. | Land | Improvement |
|---|---|---|---|---|
| 2025 | $6,326 | $352,600 | $66,700 | $285,900 |
| 2024 | $6,326 | $334,900 | $63,000 | $271,900 |
| 2023 | $4,908 | $334,900 | $63,000 | $271,900 |
| 2022 | $4,322 | $310,400 | $63,000 | $247,400 |
| 2021 | $4,564 | $268,400 | $53,700 | $214,700 |
| 2020 | $4,228 | $247,500 | $50,000 | $197,500 |
| 2019 | $4,104 | $227,500 | $46,300 | $181,200 |
| 2018 | $3,386 | $215,600 | $42,600 | $173,000 |
| 2017 | $2,506 | $202,200 | $42,600 | $159,600 |
| 2016 | $2,916 | $167,700 | $42,600 | $125,100 |
| 2015 | $3,998 | $166,500 | $42,600 | $123,900 |
| 2014 | -- | $168,500 | $42,600 | $125,900 |
Source: Public Records
Map
Nearby Homes
- 917 Division St S
- 1011 Poplar St
- 1015 College St
- 1409 Washington St
- 308 7th St E
- 405 8th St E
- 1603 Washington St
- 506 506 E 6th St
- 411 Washington St
- 408 5th St E
- 1113 Elm St
- TBB 403 (To Be Built College St
- XXXX Harvest Hills Outlook
- 1710 Harrison Ct
- 840 Fremont St E
- XXXX Division St S
- 701 3rd St W
- 504 2nd St W
- 101 Saint Olaf Ave Unit 404
- 101 Saint Olaf Ave Unit 104
- 1020 Division St S
- 1020 1020 Division-Street-s
- 1009 Water St S
- 1011 Water St S
- 1010 Division St S
- 109 Woodley St W
- 1002 Division St S
- 115 Woodley St W
- 119 Woodley St W
- 1100 Division St S
- xxxxx Division St S
- 109 Fremont St W
- 1000 Division St S
- 1101 Water St S
- 1009 Division St S
- 1010 Water St S
- 1012 Water St S
- 1007 Division St S
- 1008 Water St S
- 1008 1008 Water-Street-s