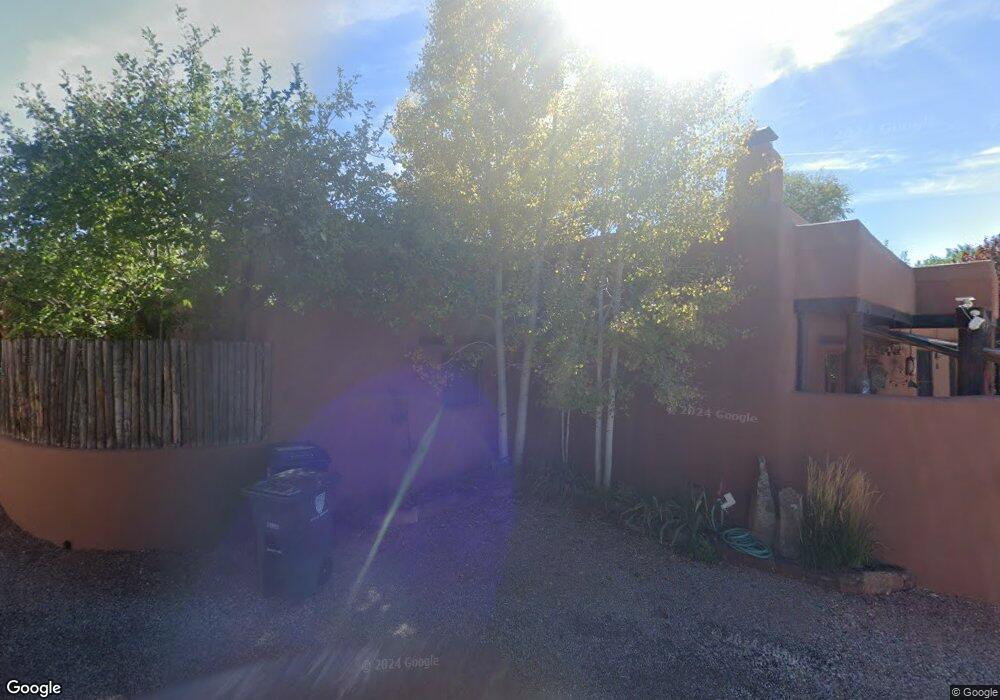
102 Montoya Cir Santa Fe, NM 87501
North Hills NeighborhoodEstimated Value: $768,000 - $980,000
1
Bed
1
Bath
1,217
Sq Ft
$740/Sq Ft
Est. Value
About This Home
This home is located at 102 Montoya Cir, Santa Fe, NM 87501 and is currently estimated at $900,813, approximately $740 per square foot. 102 Montoya Cir is a home located in Santa Fe County with nearby schools including Acequia Madre Elementary School, Santa Fe High School, and New Mexico School for the Arts.
Ownership History
Date
Name
Owned For
Owner Type
Purchase Details
Closed on
May 20, 2020
Sold by
Laughlin Robin K
Bought by
Goytowski Duane
Current Estimated Value
Home Financials for this Owner
Home Financials are based on the most recent Mortgage that was taken out on this home.
Original Mortgage
$480,000
Outstanding Balance
$425,347
Interest Rate
3.3%
Mortgage Type
New Conventional
Estimated Equity
$475,466
Purchase Details
Closed on
Mar 28, 2016
Sold by
Strickman Mathew A
Bought by
Laughilin Robin K
Purchase Details
Closed on
Jan 28, 2013
Sold by
Thomas Stephen D and Blum Evelyn S
Bought by
Strickland Matthew
Home Financials for this Owner
Home Financials are based on the most recent Mortgage that was taken out on this home.
Original Mortgage
$417,000
Interest Rate
3.42%
Mortgage Type
New Conventional
Purchase Details
Closed on
Feb 25, 2008
Sold by
Wolf Peter
Bought by
Thomas Stephen D and Blum Evelyn S
Purchase Details
Closed on
Dec 21, 2006
Sold by
Lopez Jerry and Rivera Ethel
Bought by
Wolf Peter
Create a Home Valuation Report for This Property
The Home Valuation Report is an in-depth analysis detailing your home's value as well as a comparison with similar homes in the area
Home Values in the Area
Average Home Value in this Area
Purchase History
| Date | Buyer | Sale Price | Title Company |
|---|---|---|---|
| Goytowski Duane | -- | Prima Title Llc | |
| Laughilin Robin K | -- | Prima Title Llc | |
| Strickland Matthew | -- | Prima Title Llc | |
| Thomas Stephen D | -- | St&E | |
| Wolf Peter | -- | St&E |
Source: Public Records
Mortgage History
| Date | Status | Borrower | Loan Amount |
|---|---|---|---|
| Open | Goytowski Duane | $480,000 | |
| Previous Owner | Strickland Matthew | $417,000 |
Source: Public Records
Tax History Compared to Growth
Tax History
| Year | Tax Paid | Tax Assessment Tax Assessment Total Assessment is a certain percentage of the fair market value that is determined by local assessors to be the total taxable value of land and additions on the property. | Land | Improvement |
|---|---|---|---|---|
| 2024 | $5,012 | $657,701 | $121,696 | $536,005 |
| 2023 | $5,012 | $638,546 | $118,152 | $520,394 |
| 2022 | $4,901 | $619,948 | $114,711 | $505,237 |
| 2021 | $4,825 | $200,631 | $37,123 | $163,508 |
| 2020 | $4,898 | $203,847 | $37,123 | $166,724 |
| 2019 | $5,140 | $210,631 | $55,749 | $154,882 |
| 2018 | $5,069 | $206,206 | $55,749 | $150,457 |
| 2017 | $4,981 | $201,781 | $55,749 | $146,032 |
| 2016 | $3,667 | $152,961 | $83,333 | $69,628 |
| 2015 | $3,534 | $148,506 | $83,333 | $65,173 |
| 2014 | $3,637 | $155,524 | $83,250 | $72,274 |
Source: Public Records
Map
Nearby Homes
- 5 Cerro Gordo Rd Unit 1
- 1 Cerro Gordo Rd Unit B
- 259 Montoya Cir Unit 2
- 868 E Alameda St
- 942 Canyon Rd Unit A & B
- 924 Canyon Rd
- 653 Canyon Rd Unit 11
- 808 La Vereda Este
- 800 La Vereda Este
- 630 E Alameda St Unit A, B, C, E, F, G & I
- 812 La Vereda Este
- 1018 1/2 Canyon Rd
- 707 E Palace Ave Unit 8
- 707 E Palace Ave Unit 11
- 113 Cantera Cir
- 420 Camino Don Miguel
- 637 E Alameda St
- 634 Canyon Rd
- 1047B Camino San Acacio
- 414 A and B Camino Don Miguel
- 102 Montoya Cir
- 102 Montoya Cir
- 230 Montoya Cir
- 32 Montoya Cir
- 3 Montoya Cir
- 30 Montoya Cir
- 12 Montoya Cir
- 2 Montoya Cir
- 5 Montoya Cir
- 4 Montoya Cir
- 224 Montoya Cir Unit 1 C
- 224 Montoya Cir
- 184 Montoya Cir
- 20 Montoya Cir
- 31 Montoya Cir
- 223 Montoya Cir
- 7 Montoya Cir
- 10 Montoya Cir
- 21 Montoya Cir
- 225 Montoya Cir