Estimated Value: $1,059,477
--
Bed
--
Bath
3,255
Sq Ft
$325/Sq Ft
Est. Value
About This Home
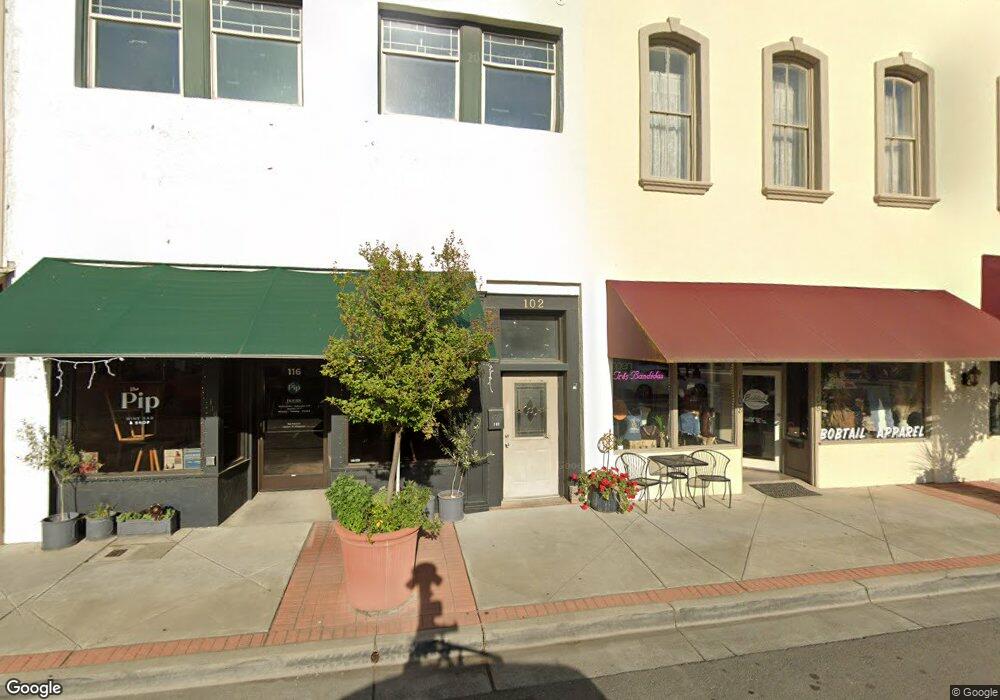
This home is located at 102 N 1st St Unit D, Dixon, CA 95620 and is currently estimated at $1,059,477, approximately $325 per square foot. 102 N 1st St Unit D is a home located in Solano County with nearby schools including Anderson (Linford L.) Elementary School, Dixon High School, and Dixon Montessori Charter.
Ownership History
Date
Name
Owned For
Owner Type
Purchase Details
Closed on
Aug 23, 2002
Sold by
Robinson Rebecca Woolf
Bought by
Leneker Ronald R
Current Estimated Value
Home Financials for this Owner
Home Financials are based on the most recent Mortgage that was taken out on this home.
Original Mortgage
$186,000
Outstanding Balance
$78,030
Interest Rate
6.43%
Mortgage Type
Commercial
Estimated Equity
$981,447
Purchase Details
Closed on
Apr 18, 2001
Sold by
Mendoza Rebecca and Woolf Rebecca
Bought by
Robinson Rebecca Woolf
Home Financials for this Owner
Home Financials are based on the most recent Mortgage that was taken out on this home.
Original Mortgage
$160,000
Interest Rate
6.98%
Mortgage Type
Commercial
Purchase Details
Closed on
Jan 27, 2001
Sold by
Mcclatchy J J
Bought by
Coats Michael L and Coats Cheryl
Purchase Details
Closed on
Jan 26, 2001
Sold by
Coats Michael L and Coats Cheryl
Bought by
Robinson Rebecca
Create a Home Valuation Report for This Property
The Home Valuation Report is an in-depth analysis detailing your home's value as well as a comparison with similar homes in the area
Home Values in the Area
Average Home Value in this Area
Purchase History
| Date | Buyer | Sale Price | Title Company |
|---|---|---|---|
| Leneker Ronald R | $475,000 | First American Title Co Napa | |
| Robinson Rebecca Woolf | -- | First American Title Guarant | |
| Coats Michael L | $20,000 | -- | |
| Robinson Rebecca | $67,000 | -- |
Source: Public Records
Mortgage History
| Date | Status | Borrower | Loan Amount |
|---|---|---|---|
| Open | Leneker Ronald R | $186,000 | |
| Previous Owner | Robinson Rebecca Woolf | $160,000 |
Source: Public Records
Tax History Compared to Growth
Tax History
| Year | Tax Paid | Tax Assessment Tax Assessment Total Assessment is a certain percentage of the fair market value that is determined by local assessors to be the total taxable value of land and additions on the property. | Land | Improvement |
|---|---|---|---|---|
| 2025 | $961 | $85,858 | $32,676 | $53,182 |
| 2024 | $961 | $84,176 | $32,036 | $52,140 |
| 2023 | $933 | $82,526 | $31,408 | $51,118 |
| 2022 | $920 | $80,909 | $30,793 | $50,116 |
| 2021 | $909 | $79,324 | $30,190 | $49,134 |
| 2020 | $894 | $78,512 | $29,881 | $48,631 |
| 2019 | $878 | $76,974 | $29,296 | $47,678 |
| 2018 | $874 | $75,466 | $28,722 | $46,744 |
| 2017 | $853 | $73,987 | $28,159 | $45,828 |
| 2016 | $807 | $72,537 | $27,607 | $44,930 |
| 2015 | $788 | $71,449 | $27,193 | $44,256 |
| 2014 | $780 | $70,051 | $26,661 | $43,390 |
Source: Public Records
Map
Nearby Homes
- 241 S 1st St
- 650 Marvin Way
- 205 W Cherry St
- 621 W D St S
- 700 W A St
- 10 Solano Dr
- 22 Sierra Dr
- 741 W D St S
- 720 E Creekside Cir
- 610 Sierra Dr
- 755 East Ct
- 540 Glenside Dr
- 865 Camelia Dr
- 640 Berkshire Dr
- 1535 Eisenhower Ct
- 255 Alderglen Dr
- 715 Berkshire Ct
- 1090 Davidson Ct
- 550 N Lincoln St
- 2290 Maze Way