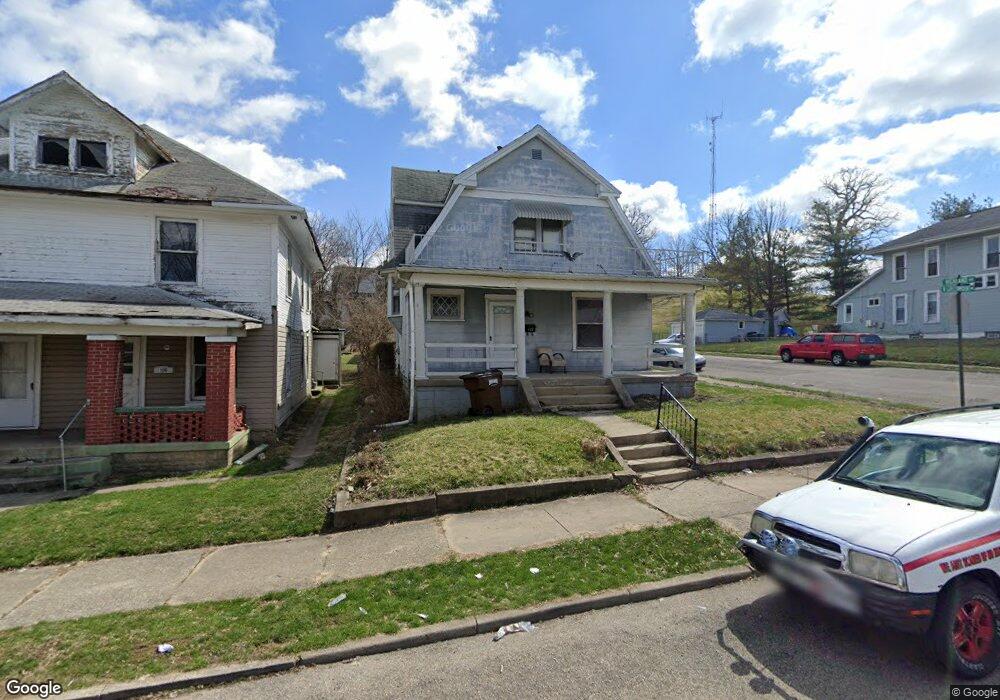
102 N Greenmount Ave Springfield, OH 45503
Estimated Value: $78,000 - $131,000
3
Beds
1
Bath
1,680
Sq Ft
$61/Sq Ft
Est. Value
About This Home
This home is located at 102 N Greenmount Ave, Springfield, OH 45503 and is currently estimated at $101,697, approximately $60 per square foot. 102 N Greenmount Ave is a home located in Clark County with nearby schools including Warder Park-Wayne Elementary School, Schaefer Middle School, and Springfield High School.
Ownership History
Date
Name
Owned For
Owner Type
Purchase Details
Closed on
Jul 31, 2012
Sold by
Miller Nolan A
Bought by
Mo Mad Dad Properties Llc
Current Estimated Value
Purchase Details
Closed on
Sep 17, 2010
Sold by
Usa Rental Fund Llc
Bought by
Miller Nolan A
Purchase Details
Closed on
Jun 30, 2010
Sold by
Fannie Mae
Bought by
Usa Rental Fund Llc
Purchase Details
Closed on
Nov 6, 2009
Sold by
Monto Scott A
Bought by
Federal National Mortgage Association
Purchase Details
Closed on
Jan 5, 2007
Sold by
See Bonnie J and Hope Daniel J
Bought by
Monto Scott A
Home Financials for this Owner
Home Financials are based on the most recent Mortgage that was taken out on this home.
Original Mortgage
$61,600
Interest Rate
6.24%
Mortgage Type
Purchase Money Mortgage
Purchase Details
Closed on
Oct 30, 1998
Sold by
Herzog Mary M
Bought by
See Bonnie J
Home Financials for this Owner
Home Financials are based on the most recent Mortgage that was taken out on this home.
Original Mortgage
$41,871
Interest Rate
6.72%
Mortgage Type
FHA
Create a Home Valuation Report for This Property
The Home Valuation Report is an in-depth analysis detailing your home's value as well as a comparison with similar homes in the area
Home Values in the Area
Average Home Value in this Area
Purchase History
| Date | Buyer | Sale Price | Title Company |
|---|---|---|---|
| Mo Mad Dad Properties Llc | -- | Attorney | |
| Miller Nolan A | $13,700 | Valmer Land Title Agency Llc | |
| Usa Rental Fund Llc | $3,500 | Attorney | |
| Federal National Mortgage Association | $30,000 | None Available | |
| Monto Scott A | $77,000 | Christopher Land Title | |
| See Bonnie J | $41,500 | -- |
Source: Public Records
Mortgage History
| Date | Status | Borrower | Loan Amount |
|---|---|---|---|
| Previous Owner | Monto Scott A | $61,600 | |
| Previous Owner | See Bonnie J | $41,871 |
Source: Public Records
Tax History
| Year | Tax Paid | Tax Assessment Tax Assessment Total Assessment is a certain percentage of the fair market value that is determined by local assessors to be the total taxable value of land and additions on the property. | Land | Improvement |
|---|---|---|---|---|
| 2025 | $948 | $26,380 | $1,780 | $24,600 |
| 2024 | $924 | $18,710 | $1,500 | $17,210 |
| 2023 | $924 | $18,710 | $1,500 | $17,210 |
| 2022 | $871 | $18,710 | $1,500 | $17,210 |
| 2021 | $871 | $15,850 | $1,270 | $14,580 |
| 2020 | $873 | $15,850 | $1,270 | $14,580 |
| 2019 | $875 | $15,850 | $1,270 | $14,580 |
| 2018 | $883 | $15,350 | $1,270 | $14,080 |
| 2017 | $882 | $15,352 | $1,271 | $14,081 |
| 2016 | $884 | $15,352 | $1,271 | $14,081 |
| 2015 | $901 | $15,352 | $1,271 | $14,081 |
| 2014 | $897 | $15,352 | $1,271 | $14,081 |
| 2013 | $887 | $15,352 | $1,271 | $14,081 |
Source: Public Records
Map
Nearby Homes
- 1570 Morgan St
- 14 N Freeman St
- 1621 Morgan St
- 1105 Farlow St
- 1664 Warder St
- 1602 Prospect St
- 1703 Highland Ave
- 1707 Highland Ave
- 1215 E High St
- 1721 Prospect St
- 1569-1571 Mound St
- 1223 Lagonda Ave
- 321 Glenn Ave
- 360 S Greenmount Ave
- 802 Warder St
- 1654 Catawba Ave
- 803 Laurel St
- 1701 Lexington Ave
- 1609 Irwin Ave
- 1634 Edwards Ave
- 106 N Greenmount Ave Unit 108
- 1364 Highland Ave
- 110 N Greenmount Ave
- 36 N Greenmount Ave
- 114 N Greenmount Ave Unit 116
- 1370 Highland Ave
- 120 N Greenmount Ave
- 107 N Greenmount Ave
- 111 N Greenmount Ave
- 1404 Highland Ave
- 35 N Greenmount Ave
- 115 N Greenmount Ave
- 122 N Greenmount Ave
- 31 N Greenmount Ave
- 119 N Greenmount Ave
- 1412 Highland Ave
- 126 N Greenmount Ave
- 123 N Greenmount Ave
- 1369 Warder St
- 1414 Highland Ave
Your Personal Tour Guide
Ask me questions while you tour the home.