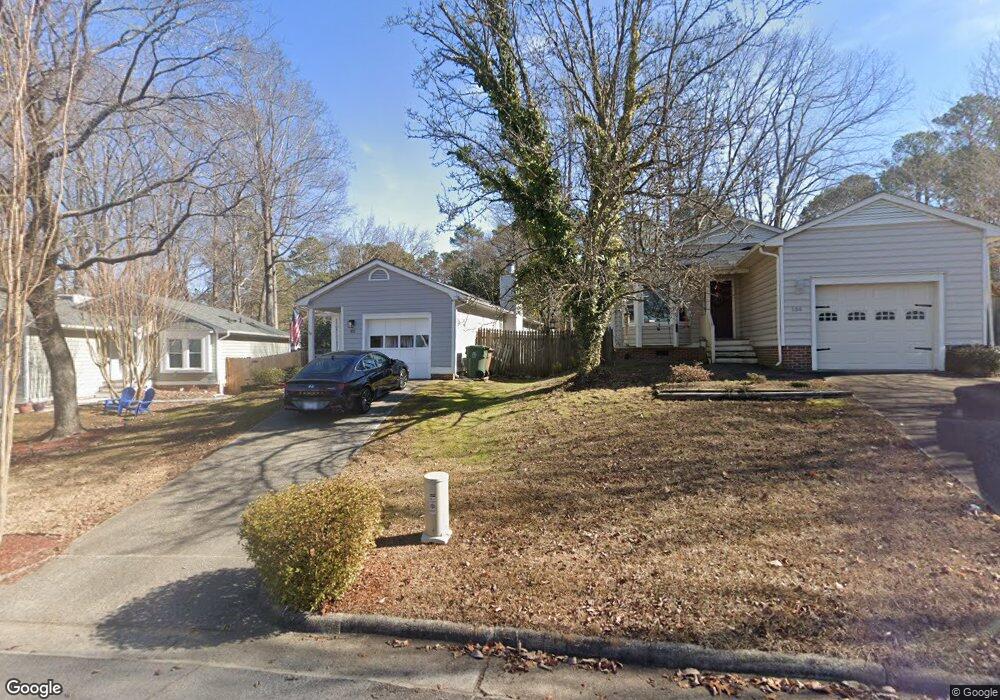
102 Oak Hill Loop Cary, NC 27513
Weston NeighborhoodEstimated Value: $339,000 - $406,000
3
Beds
2
Baths
1,072
Sq Ft
$338/Sq Ft
Est. Value
About This Home
This home is located at 102 Oak Hill Loop, Cary, NC 27513 and is currently estimated at $361,854, approximately $337 per square foot. 102 Oak Hill Loop is a home located in Wake County with nearby schools including Reedy Creek Elementary School, Reedy Creek Magnet Middle School, and Cary High School.
Ownership History
Date
Name
Owned For
Owner Type
Purchase Details
Closed on
Sep 23, 2016
Sold by
Kingsbury Wendy D
Bought by
Farinella Christopher Anthony and Farinella Lisbeth Duarte
Current Estimated Value
Home Financials for this Owner
Home Financials are based on the most recent Mortgage that was taken out on this home.
Original Mortgage
$222,095
Outstanding Balance
$177,515
Interest Rate
3.45%
Mortgage Type
New Conventional
Estimated Equity
$184,339
Purchase Details
Closed on
Sep 30, 2008
Sold by
Whitcher Lois and Whitcher Robin
Bought by
Kingsbury Wendy D
Home Financials for this Owner
Home Financials are based on the most recent Mortgage that was taken out on this home.
Original Mortgage
$155,158
Interest Rate
6.49%
Mortgage Type
FHA
Create a Home Valuation Report for This Property
The Home Valuation Report is an in-depth analysis detailing your home's value as well as a comparison with similar homes in the area
Home Values in the Area
Average Home Value in this Area
Purchase History
| Date | Buyer | Sale Price | Title Company |
|---|---|---|---|
| Farinella Christopher Anthony | $215,000 | None Available | |
| Kingsbury Wendy D | $156,000 | None Available |
Source: Public Records
Mortgage History
| Date | Status | Borrower | Loan Amount |
|---|---|---|---|
| Open | Farinella Christopher Anthony | $222,095 | |
| Previous Owner | Kingsbury Wendy D | $155,158 |
Source: Public Records
Tax History
| Year | Tax Paid | Tax Assessment Tax Assessment Total Assessment is a certain percentage of the fair market value that is determined by local assessors to be the total taxable value of land and additions on the property. | Land | Improvement |
|---|---|---|---|---|
| 2025 | $2,900 | $336,048 | $155,000 | $181,048 |
| 2024 | $2,838 | $336,048 | $155,000 | $181,048 |
Source: Public Records
Map
Nearby Homes
- 112 Rock Pointe Ln
- 292 Beechtree Dr
- 319 Silverberry Ct
- 102 Bathgate Ln
- 1399 N Harrison Ave
- 401 Tynemouth Dr
- 917 Reedy Creek Rd
- 106 Eagle Swoop Ct
- 109 Silverrock Ct
- 212 Esquire Ln
- 101 Red Stone Ct
- 508 Nantucket Dr
- 102 Choptank Ct Unit B2
- 209 Juliet Cir
- 105 Twilight Ct
- 101 Brant Point Place
- 201 Windbyrne Dr
- 316 Matilda Place
- 220 Windbyrne Dr Unit 38
- 243 Windbyrne Dr
- 100 Oak Hill Loop
- 104 Oak Hill Loop
- 114 Rock Pointe Ln
- 116 Rock Pointe Ln
- 106 Oak Hill Loop
- 103 Oak Hill Loop
- 101 Oak Hill Loop
- 108 Oak Hill Loop
- 105 Oak Hill Loop
- 110 Oak Hill Loop
- 202 Beechtree Dr
- 119 Rock Pointe Ln
- 112 Oak Hill Loop
- 115 Rock Pointe Ln
- 107 Oak Hill Loop
- 204 Beechtree Dr
- 114 Oak Hill Loop
- 108 Rock Pointe Ln
- 109 Oak Hill Loop
- 116 Oak Hill Loop
Your Personal Tour Guide
Ask me questions while you tour the home.