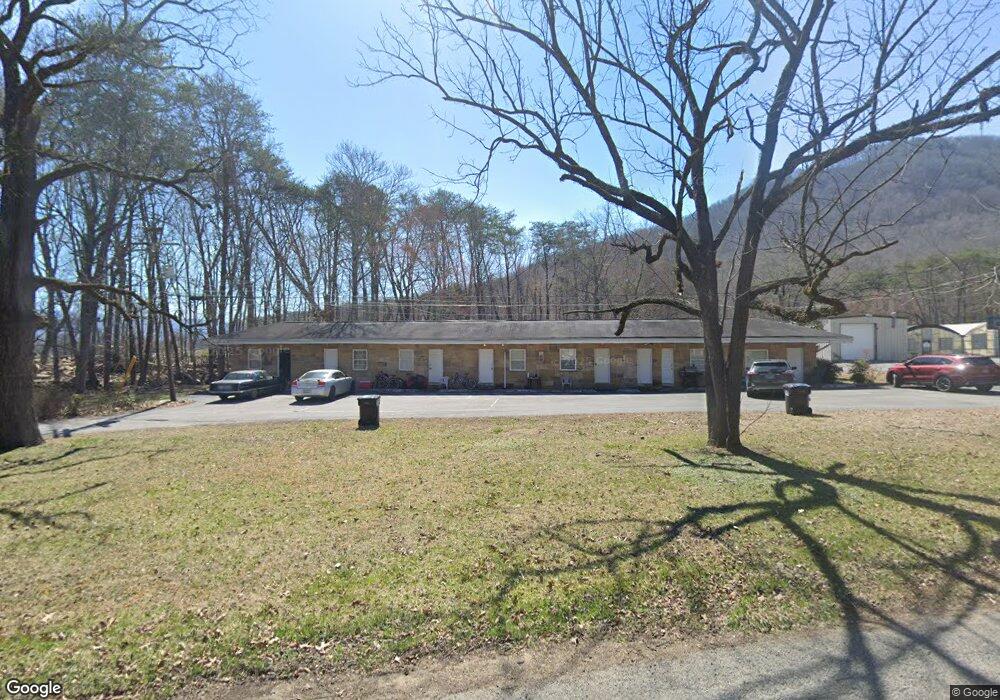
102 Old State Highway 8 Dunlap, TN 37327
Estimated Value: $221,829 - $234,000
3
Beds
2
Baths
1,221
Sq Ft
$187/Sq Ft
Est. Value
About This Home
This home is located at 102 Old State Highway 8, Dunlap, TN 37327 and is currently estimated at $227,957, approximately $186 per square foot. 102 Old State Highway 8 is a home located in Sequatchie County with nearby schools including Griffith Elementary School, Sequatchie County Middle School, and Sequatchie County High School.
Ownership History
Date
Name
Owned For
Owner Type
Purchase Details
Closed on
Sep 30, 2015
Sold by
Gaal Sarah
Bought by
Kilgore Anna J and Kilgore Ronnie Lee
Current Estimated Value
Home Financials for this Owner
Home Financials are based on the most recent Mortgage that was taken out on this home.
Original Mortgage
$55,000
Outstanding Balance
$32,379
Interest Rate
3.93%
Mortgage Type
New Conventional
Estimated Equity
$195,578
Purchase Details
Closed on
Oct 6, 2008
Sold by
Dutsche Bank National Trus
Bought by
Gaal Sarah
Purchase Details
Closed on
Apr 12, 2008
Bought by
Deutsche Bank National Trust Co
Purchase Details
Closed on
Mar 20, 2004
Bought by
Conner Mark and Wife Angela Brooke
Purchase Details
Closed on
Sep 29, 2000
Sold by
Darrell Johnson and Darrell Wife
Bought by
Lewis Johnny E and Lewis Loren M
Create a Home Valuation Report for This Property
The Home Valuation Report is an in-depth analysis detailing your home's value as well as a comparison with similar homes in the area
Home Values in the Area
Average Home Value in this Area
Purchase History
| Date | Buyer | Sale Price | Title Company |
|---|---|---|---|
| Kilgore Anna J | $57,000 | -- | |
| Gaal Sarah | $73,500 | -- | |
| Deutsche Bank National Trust Co | $72,200 | -- | |
| Conner Mark | -- | -- | |
| Lewis Johnny E | $60,000 | -- |
Source: Public Records
Mortgage History
| Date | Status | Borrower | Loan Amount |
|---|---|---|---|
| Open | Kilgore Anna J | $55,000 |
Source: Public Records
Tax History Compared to Growth
Tax History
| Year | Tax Paid | Tax Assessment Tax Assessment Total Assessment is a certain percentage of the fair market value that is determined by local assessors to be the total taxable value of land and additions on the property. | Land | Improvement |
|---|---|---|---|---|
| 2025 | -- | $43,025 | $0 | $0 |
| 2024 | -- | $43,025 | $4,650 | $38,375 |
| 2023 | $1,039 | $43,025 | $4,650 | $38,375 |
| 2022 | $690 | $20,800 | $3,675 | $17,125 |
| 2021 | $680 | $20,800 | $3,675 | $17,125 |
| 2020 | $680 | $20,800 | $3,675 | $17,125 |
| 2019 | $680 | $20,800 | $3,675 | $17,125 |
| 2018 | $672 | $20,800 | $3,675 | $17,125 |
| 2017 | $664 | $20,800 | $3,675 | $17,125 |
| 2016 | $713 | $21,400 | $3,675 | $17,725 |
| 2015 | $713 | $21,400 | $3,675 | $17,725 |
| 2014 | $713 | $21,400 | $3,675 | $17,725 |
Source: Public Records
Map
Nearby Homes
- 801 Tram Trail
- 563 Old Union Rd
- 1 W Brow Rd
- 496 Boyd Rd
- 217 A Day Dream Dr
- 267 Williams Rd
- 448 Angel Oak Dr
- 381 Angel Oak Dr
- 2000 Fredonia Rd
- 345 Angel Oak Dr
- 79 Bear Oak Dr
- 152 Bear Oak Dr
- 142 Bear Oak Dr
- 110 Bear Oak Dr
- 44 Bear Oak Dr
- 397 Angel Oak Dr
- 226 Bear Oak Dr
- 0 Fredonia Loop
- 239 Bear Oak Dr
- 102 Old State Highway 8
- 1 Old Union Rd
- 3 Old Union Rd
- 5 Old Union Rd
- 53 Mountain Valley Dr E
- 53 Mountain Valley Dr E Unit 1
- 53 Mountain Valley Dr E
- 302 Stone Cir
- 311 Stone Cir
- 300 Stone Cir
- 2 Old Union Rd
- 4 Old Union Rd
- 60 Mountain Valley Dr
- 1275 Tram Trail
- 1293 Tram Trail
- 400 Old State Hwy 8 111
- 33 Mountain Valley Dr W
- 33 Mountain Valley Dr W Unit 2/Duplex
- Lot 27 Old State Hwy 27
- 545 Old State Highway 8