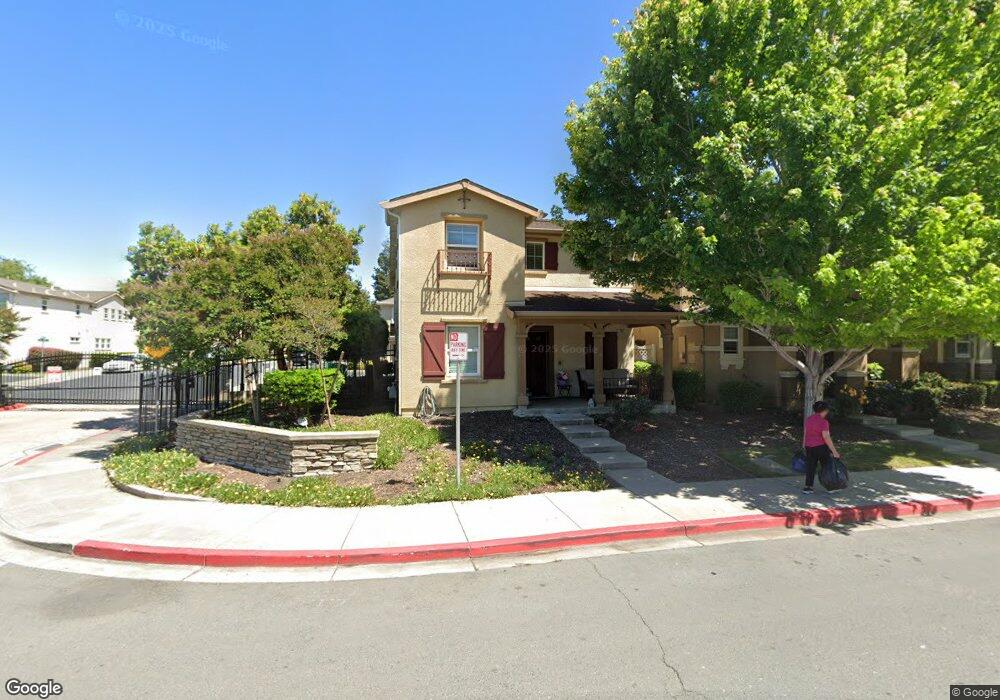
102 Olmsted Ct Pittsburg, CA 94565
Meadowbrook NeighborhoodEstimated Value: $600,000 - $689,000
4
Beds
3
Baths
2,031
Sq Ft
$311/Sq Ft
Est. Value
About This Home
This home is located at 102 Olmsted Ct, Pittsburg, CA 94565 and is currently estimated at $632,201, approximately $311 per square foot. 102 Olmsted Ct is a home located in Contra Costa County with nearby schools including Stoneman Elementary School, Hillview Junior High School, and Pittsburg Senior High School.
Ownership History
Date
Name
Owned For
Owner Type
Purchase Details
Closed on
Nov 14, 2024
Sold by
102 Omstead Court Trust and Hoag Havy Shune
Bought by
Havy Shune Hoag 2018 Revocable Living Trust and Hoag
Current Estimated Value
Purchase Details
Closed on
Feb 12, 2022
Sold by
Havy Shune Hoag 2018 Revocable Living Tr
Bought by
102 Omstead Court Trust
Purchase Details
Closed on
Jan 9, 2018
Sold by
Hoag Havy Shune
Bought by
Hoag Havy Shune
Purchase Details
Closed on
Aug 9, 2017
Sold by
Salim Suna
Bought by
Haag Havy S
Home Financials for this Owner
Home Financials are based on the most recent Mortgage that was taken out on this home.
Original Mortgage
$322,500
Interest Rate
4.03%
Mortgage Type
New Conventional
Purchase Details
Closed on
May 14, 2014
Sold by
Drennan Curtis and Drennan Eleanor L
Bought by
Salim Suna
Purchase Details
Closed on
Nov 3, 2008
Sold by
Kb Home South Bay Inc
Bought by
Drennan Curtis E and Drennan Eleanor L
Home Financials for this Owner
Home Financials are based on the most recent Mortgage that was taken out on this home.
Original Mortgage
$272,050
Interest Rate
5.9%
Mortgage Type
VA
Create a Home Valuation Report for This Property
The Home Valuation Report is an in-depth analysis detailing your home's value as well as a comparison with similar homes in the area
Home Values in the Area
Average Home Value in this Area
Purchase History
| Date | Buyer | Sale Price | Title Company |
|---|---|---|---|
| Havy Shune Hoag 2018 Revocable Living Trust | -- | None Listed On Document | |
| 102 Omstead Court Trust | -- | None Listed On Document | |
| Hoag Havy Shune | -- | None Available | |
| Haag Havy S | $430,000 | Ort | |
| Salim Suna | $310,000 | Chicago Title Company | |
| Drennan Curtis E | $263,500 | First American Title Company |
Source: Public Records
Mortgage History
| Date | Status | Borrower | Loan Amount |
|---|---|---|---|
| Previous Owner | Haag Havy S | $322,500 | |
| Previous Owner | Drennan Curtis E | $272,050 |
Source: Public Records
Tax History Compared to Growth
Tax History
| Year | Tax Paid | Tax Assessment Tax Assessment Total Assessment is a certain percentage of the fair market value that is determined by local assessors to be the total taxable value of land and additions on the property. | Land | Improvement |
|---|---|---|---|---|
| 2025 | $6,836 | $489,261 | $159,294 | $329,967 |
| 2024 | $6,808 | $479,669 | $156,171 | $323,498 |
| 2023 | $6,808 | $470,264 | $153,109 | $317,155 |
| 2022 | $6,862 | $461,044 | $150,107 | $310,937 |
| 2021 | $6,837 | $452,005 | $147,164 | $304,841 |
| 2019 | $6,491 | $438,600 | $142,800 | $295,800 |
| 2018 | $6,249 | $430,000 | $140,000 | $290,000 |
| 2017 | $5,084 | $327,433 | $73,935 | $253,498 |
| 2016 | $4,772 | $321,014 | $72,486 | $248,528 |
| 2015 | $4,906 | $316,193 | $71,398 | $244,795 |
| 2014 | $4,267 | $276,697 | $21,008 | $255,689 |
Source: Public Records
Map
Nearby Homes