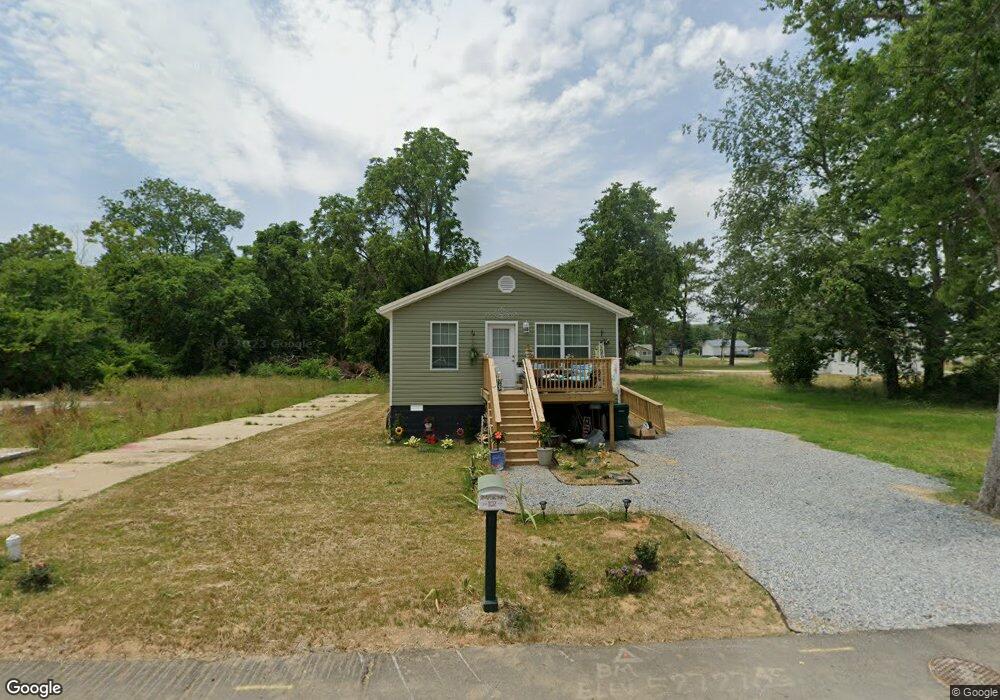
102 Simpson Ave Waverly, TN 37185
Estimated Value: $115,161 - $151,000
Studio
1
Bath
864
Sq Ft
$158/Sq Ft
Est. Value
About This Home
This home is located at 102 Simpson Ave, Waverly, TN 37185 and is currently estimated at $136,720, approximately $158 per square foot. 102 Simpson Ave is a home located in Humphreys County.
Ownership History
Date
Name
Owned For
Owner Type
Purchase Details
Closed on
Mar 8, 2023
Sold by
Appalachia Service Project Inc
Bought by
Maddox Jenny Liane
Current Estimated Value
Purchase Details
Closed on
Mar 6, 2023
Sold by
Appalachia Service Project Inc
Bought by
Haas Kevin Lee and Haas Patricia K
Purchase Details
Closed on
Aug 30, 2022
Sold by
Gillespie and Jessica
Bought by
Appalachia Service Project Inc
Purchase Details
Closed on
Jan 19, 2022
Sold by
Davis Jr Lewis D and Davis Donna J
Bought by
Wilson Jonathan Shaun and Davis David Christopher
Purchase Details
Closed on
Mar 7, 2019
Sold by
Bradley James J
Bought by
Davis Lewis D
Purchase Details
Closed on
Mar 5, 2019
Sold by
Bradley James Joseph and Bradley Cathy
Bought by
Davis Lewis D and Davis Donna J
Purchase Details
Closed on
Apr 18, 1995
Bought by
Bradley James J and And Lewis D Davis
Purchase Details
Closed on
Mar 28, 1986
Purchase Details
Closed on
Oct 7, 1985
Purchase Details
Closed on
Feb 25, 1952
Create a Home Valuation Report for This Property
The Home Valuation Report is an in-depth analysis detailing your home's value as well as a comparison with similar homes in the area
Home Values in the Area
Average Home Value in this Area
Purchase History
| Date | Buyer | Sale Price | Title Company |
|---|---|---|---|
| Maddox Jenny Liane | $100,000 | -- | |
| Haas Kevin Lee | $100,000 | -- | |
| Appalachia Service Project Inc | $7,000 | None Listed On Document | |
| Wilson Jonathan Shaun | -- | Porch Peeler Williams & Thomas | |
| Davis Lewis D | -- | None Available | |
| Davis Lewis D | -- | None Available | |
| Davis Donna J | -- | None Available | |
| Bradley James J | $28,500 | -- | |
| -- | -- | -- | |
| -- | -- | -- | |
| -- | -- | -- |
Source: Public Records
Tax History
| Year | Tax Paid | Tax Assessment Tax Assessment Total Assessment is a certain percentage of the fair market value that is determined by local assessors to be the total taxable value of land and additions on the property. | Land | Improvement |
|---|---|---|---|---|
| 2025 | $915 | $30,100 | $1,750 | $28,350 |
| 2024 | $918 | $30,100 | $1,750 | $28,350 |
| 2023 | $766 | $30,100 | $1,750 | $28,350 |
| 2022 | $43 | $1,325 | $1,325 | $0 |
| 2021 | $186 | $1,325 | $1,325 | $0 |
| 2020 | $268 | $8,350 | $1,325 | $7,025 |
| 2019 | $228 | $6,925 | $1,300 | $5,625 |
| 2018 | $228 | $6,925 | $1,300 | $5,625 |
| 2017 | $228 | $6,925 | $1,300 | $5,625 |
| 2016 | $209 | $5,875 | $1,300 | $4,575 |
| 2015 | $209 | $5,875 | $1,300 | $4,575 |
| 2014 | $209 | $5,881 | $0 | $0 |
Source: Public Records
Map
Nearby Homes
- 206 Joe St
- 101 Simpson Ave
- 311 E Main St
- 120 Joe St
- 104 Fairground Dr
- 102 N Cooley Ave
- 202 Pine Hill Dr
- 128 Washington Cir
- 207 Sycamore Ave
- 0 Bear Hollow Dr Unit 120
- 0 Bear Hollow Dr Unit RTC2747935
- 105 Hillwood Dr
- 202 E Richland Ave
- 375 Highway 13 N
- 0 Matthews Hollow Rd
- 312 N Maple Ave
- 805 E Railroad St
- 781 Highway 13 S
- 780 Highway 13 N
- 114 Sutton Ave
Your Personal Tour Guide
Ask me questions while you tour the home.