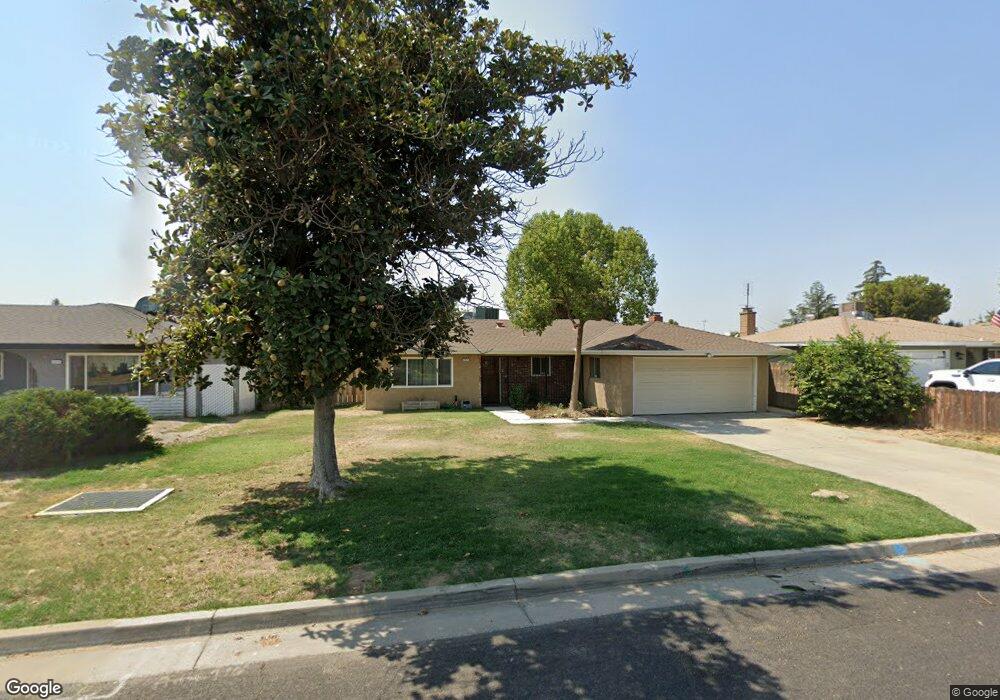
1020 Joy St Madera, CA 93637
West Madera NeighborhoodEstimated Value: $353,882 - $385,000
3
Beds
2
Baths
1,541
Sq Ft
$240/Sq Ft
Est. Value
About This Home
This home is located at 1020 Joy St, Madera, CA 93637 and is currently estimated at $369,221, approximately $239 per square foot. 1020 Joy St is a home located in Madera County with nearby schools including John Adams Elementary School, Thomas Jefferson Middle School, and Madera High School.
Ownership History
Date
Name
Owned For
Owner Type
Purchase Details
Closed on
Nov 13, 2023
Sold by
Nash Sherri Lynne
Bought by
2004 Sherri L Nash-Tice Revocable Trust and Nash-Tice
Current Estimated Value
Purchase Details
Closed on
Nov 8, 2023
Sold by
Nash Sherri Lynne
Bought by
2004 Sherri L Nash-Tice Revocable Trust and Nash-Tice
Purchase Details
Closed on
Sep 1, 2016
Sold by
Nash Sherri Lynne and The Martha Elizabeth Nash Revo
Bought by
Nash Sherri Lynne
Purchase Details
Closed on
Oct 16, 2014
Sold by
Nash Martha E
Bought by
Revocabl Nash Martha E and Revocabl Martha Elizabeth Nash
Create a Home Valuation Report for This Property
The Home Valuation Report is an in-depth analysis detailing your home's value as well as a comparison with similar homes in the area
Home Values in the Area
Average Home Value in this Area
Purchase History
| Date | Buyer | Sale Price | Title Company |
|---|---|---|---|
| 2004 Sherri L Nash-Tice Revocable Trust | -- | None Listed On Document | |
| 2004 Sherri L Nash-Tice Revocable Trust | -- | None Listed On Document | |
| Nash Sherri Lynne | -- | None Available | |
| Revocabl Nash Martha E | -- | None Available |
Source: Public Records
Tax History
| Year | Tax Paid | Tax Assessment Tax Assessment Total Assessment is a certain percentage of the fair market value that is determined by local assessors to be the total taxable value of land and additions on the property. | Land | Improvement |
|---|---|---|---|---|
| 2025 | $1,168 | $98,658 | $24,637 | $74,021 |
| 2023 | $1,168 | $94,829 | $23,681 | $71,148 |
| 2022 | $1,093 | $91,148 | $22,762 | $68,386 |
| 2021 | $2,213 | $190,850 | $53,609 | $137,241 |
| 2020 | $2,253 | $188,894 | $53,060 | $135,834 |
| 2019 | $2,237 | $185,191 | $52,020 | $133,171 |
| 2018 | $2,064 | $181,560 | $51,000 | $130,560 |
| 2017 | $2,040 | $178,000 | $50,000 | $128,000 |
| 2016 | $958 | $82,561 | $20,618 | $61,943 |
| 2015 | $924 | $81,322 | $20,309 | $61,013 |
| 2014 | $787 | $79,730 | $19,912 | $59,818 |
Source: Public Records
Map
Nearby Homes
- 991 Baylor Ct
- 1637 Princeton Ave
- 1237 de Cesari Ave
- 1632 University Ave
- 157 N Park Dr
- 174 N Park Dr
- 15707 Road 22 1 2
- 716 Willis Ave
- 820 Columbia St
- 1803 Sunset Ave
- 817 Sierra St
- 930 Sierra St
- 430 Rotan Ave
- 363 E Rush St
- 2377 Frederick Way
- 2436 Trevor Ct
- 815 W Yosemite Ave
- 901 Valley Way
- Avenue 23
- 724 W Yosemite Ave
Your Personal Tour Guide
Ask me questions while you tour the home.