Estimated Value: $290,000 - $391,000
Studio
1
Bath
2,520
Sq Ft
$141/Sq Ft
Est. Value
About This Home
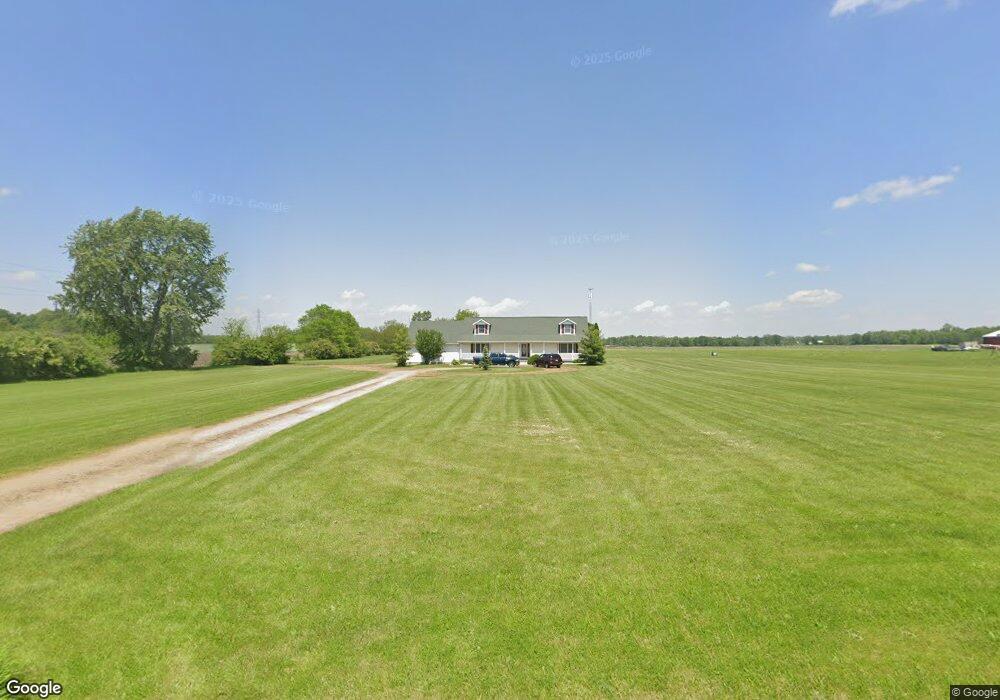
This home is located at 10200 E Windsor Rd, Selma, IN 47383 and is currently estimated at $355,430, approximately $141 per square foot. 10200 E Windsor Rd is a home located in Delaware County with nearby schools including Selma Elementary School, Selma Middle School, and Wapahani High School.
Ownership History
Date
Name
Owned For
Owner Type
Purchase Details
Closed on
Dec 21, 2017
Sold by
Hoskins Kathleen
Bought by
Hoskins Larry D
Current Estimated Value
Purchase Details
Closed on
May 28, 2010
Sold by
Bradburn Homer J
Bought by
Hoskins Larry D and Hoskins Kathleen
Home Financials for this Owner
Home Financials are based on the most recent Mortgage that was taken out on this home.
Original Mortgage
$175,610
Outstanding Balance
$116,804
Interest Rate
5.13%
Mortgage Type
VA
Estimated Equity
$238,626
Purchase Details
Closed on
Aug 8, 2006
Sold by
Marlow Menge R
Bought by
Bradburn Homer F
Purchase Details
Closed on
Mar 25, 2005
Sold by
Bradburn Homer J and Bradburn Lucille L
Bought by
Bradburn Homer J and Marlow George R
Home Financials for this Owner
Home Financials are based on the most recent Mortgage that was taken out on this home.
Original Mortgage
$131,900
Interest Rate
1.5%
Mortgage Type
Adjustable Rate Mortgage/ARM
Create a Home Valuation Report for This Property
The Home Valuation Report is an in-depth analysis detailing your home's value as well as a comparison with similar homes in the area
Purchase History
| Date | Buyer | Sale Price | Title Company |
|---|---|---|---|
| Hoskins Larry D | -- | -- | |
| Hoskins Larry D | -- | Itic | |
| Bradburn Homer F | -- | None Available | |
| Bradburn Homer J | -- | None Available |
Source: Public Records
Mortgage History
| Date | Status | Borrower | Loan Amount |
|---|---|---|---|
| Open | Hoskins Larry D | $175,610 | |
| Previous Owner | Bradburn Homer J | $131,900 |
Source: Public Records
Tax History
| Year | Tax Paid | Tax Assessment Tax Assessment Total Assessment is a certain percentage of the fair market value that is determined by local assessors to be the total taxable value of land and additions on the property. | Land | Improvement |
|---|---|---|---|---|
| 2025 | $1,999 | $374,800 | $38,800 | $336,000 |
| 2024 | $1,999 | $300,800 | $38,800 | $262,000 |
| 2023 | $1,699 | $272,900 | $38,800 | $234,100 |
| 2022 | $1,822 | $265,800 | $38,800 | $227,000 |
| 2021 | $1,693 | $236,600 | $34,500 | $202,100 |
| 2020 | $1,591 | $212,600 | $34,500 | $178,100 |
| 2019 | $1,551 | $204,700 | $32,900 | $171,800 |
| 2018 | $1,444 | $201,700 | $31,300 | $170,400 |
| 2017 | $1,248 | $156,800 | $31,300 | $125,500 |
| 2016 | $1,143 | $148,900 | $31,300 | $117,600 |
| 2014 | $1,237 | $153,500 | $32,000 | $121,500 |
| 2013 | -- | $167,600 | $35,500 | $132,100 |
Source: Public Records
Map
Nearby Homes
- 3000 Blk S Cr 575 E
- 6504 S 560 Rd E
- 11990 E County Road 400 S
- 2510 S Whitney Rd
- 7201 E Windsor Rd
- 835 S Delaware County Rd
- 10009 E Jackson St
- 134 N 1200 W
- 13661 E Co Road 575 S
- 0 S Burlington Unit 202507671
- 0 S Burlington Unit 26211996
- 0 S Burlington Unit MBR22082608
- 0 S Burlington Unit 22852763
- 204 N Cook Rd
- 9100 S US Highway 35
- 700 N Cook Rd
- 4308 E Maple Manor Pkwy
- 3410 S Burlington Dr
- 0 E Fairway Dr
- 5704 E Robert St
- 10300 E Windsor Rd
- 10301 E Windsor Rd
- 000 S County Road 600 E Unit Selma
- 0 Katie Ct Unit 20001332
- 4 S County Road 560e
- 2 S County Road 560e
- 0000 S County Road 560e
- 3000 Blk S Cr 700e
- 00 County Road 575e
- Tract 1 County Road 544e
- Tract 2 County Road 544e
- Lot 11 Sunset
- 0 Vacant Land Unit 21240257
- 0 E Land E Hills and Dales Dr Unit 202222436
- 0 Co Rd 590e & 100n (Centennial) Unit MBR2030849
- 0 E Land E Hills and Dales Dr Unit 202005567
- 0 E Land E Hills and Dales Dr Unit 201939969
- 301 S Pittenger Rd Dr
- 10431 E Windsor Rd
- 0 S County Road 700 E Unit MBR21881528
Your Personal Tour Guide
Ask me questions while you tour the home.