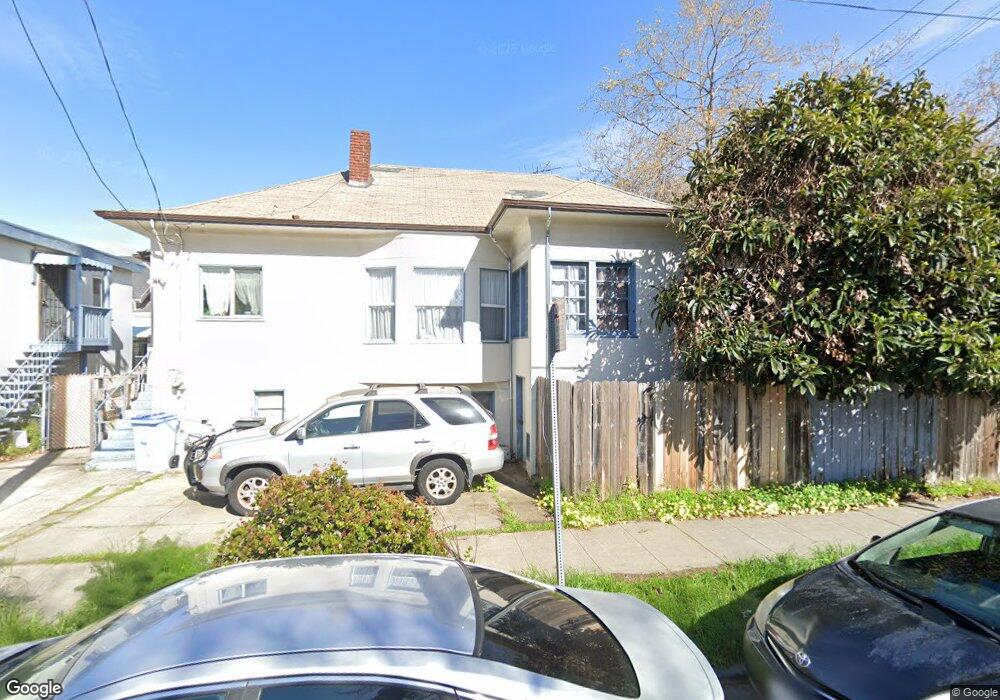
1021 Addison St Berkeley, CA 94710
West Berkeley NeighborhoodEstimated Value: $1,104,739 - $1,325,000
5
Beds
3
Baths
2,063
Sq Ft
$587/Sq Ft
Est. Value
About This Home
This home is located at 1021 Addison St, Berkeley, CA 94710 and is currently estimated at $1,211,246, approximately $587 per square foot. 1021 Addison St is a home located in Alameda County with nearby schools including Rosa Parks Elementary School, Ruth Acty Elementary, and Berkeley Arts Magnet at Whittier School.
Ownership History
Date
Name
Owned For
Owner Type
Purchase Details
Closed on
Sep 17, 2016
Sold by
Diec Ivan
Bought by
Diec Serena Le Thi
Current Estimated Value
Purchase Details
Closed on
Nov 23, 2004
Sold by
Luc Hoa Quoc
Bought by
Luc Hoa Quoc and Hoa Quoc Luc Revocable Trust
Purchase Details
Closed on
Nov 4, 2004
Sold by
Dai Hua Xu
Bought by
Luc Hoa Quoc
Purchase Details
Closed on
May 27, 1999
Sold by
Success & More Corp
Bought by
Xu Luc Hoa Ngoc and Xu Dai Hua
Home Financials for this Owner
Home Financials are based on the most recent Mortgage that was taken out on this home.
Original Mortgage
$196,000
Outstanding Balance
$50,798
Interest Rate
6.84%
Mortgage Type
Commercial
Estimated Equity
$1,160,448
Purchase Details
Closed on
Jul 29, 1998
Sold by
Swanson Eugene O and Swanson Arlene C
Bought by
Success More Corp
Purchase Details
Closed on
Apr 13, 1998
Sold by
Mcdonough Kevin J and Mcdonough Ann
Bought by
Swanson Eugene O and Swanson Arlene C
Create a Home Valuation Report for This Property
The Home Valuation Report is an in-depth analysis detailing your home's value as well as a comparison with similar homes in the area
Home Values in the Area
Average Home Value in this Area
Purchase History
| Date | Buyer | Sale Price | Title Company |
|---|---|---|---|
| Diec Serena Le Thi | -- | None Available | |
| Diec Serena Le Thi | -- | None Available | |
| Luc Hoa Quoc | -- | None Available | |
| Luc Hoa Quoc | -- | Fidelity National Title Co | |
| Xu Luc Hoa Ngoc | $245,000 | Commonwealth Land Title Co | |
| Success More Corp | $154,500 | -- | |
| Swanson Eugene O | -- | -- |
Source: Public Records
Mortgage History
| Date | Status | Borrower | Loan Amount |
|---|---|---|---|
| Open | Xu Luc Hoa Ngoc | $196,000 | |
| Closed | Xu Luc Hoa Ngoc | $24,500 |
Source: Public Records
Tax History
| Year | Tax Paid | Tax Assessment Tax Assessment Total Assessment is a certain percentage of the fair market value that is determined by local assessors to be the total taxable value of land and additions on the property. | Land | Improvement |
|---|---|---|---|---|
| 2025 | $17,873 | $1,017,379 | $373,905 | $650,474 |
| 2024 | $17,873 | $997,297 | $366,575 | $637,722 |
| 2023 | $17,480 | $984,607 | $359,388 | $625,219 |
| 2022 | $17,110 | $958,303 | $352,342 | $612,961 |
| 2021 | $17,116 | $939,380 | $345,435 | $600,945 |
| 2020 | $16,032 | $936,681 | $341,895 | $594,786 |
| 2019 | $15,227 | $918,321 | $335,193 | $583,128 |
| 2018 | $14,938 | $900,318 | $328,622 | $571,696 |
| 2017 | $14,410 | $882,668 | $322,180 | $560,488 |
| 2016 | $7,344 | $324,445 | $97,333 | $227,112 |
| 2015 | $7,217 | $319,572 | $95,871 | $223,701 |
| 2014 | $7,266 | $313,313 | $93,994 | $219,319 |
Source: Public Records
Map
Nearby Homes
- 2013 9th St
- 2144 Curtis St
- 2241 Ninth St
- 1050 Allston Way
- 1919 Curtis St
- 2231 Byron St
- 940 Delaware St
- 931 Bancroft Way
- 1128 Delaware St
- 2220 7th St
- 2238 7th St
- 2327 10th St Unit 4
- 1261 Hearst Ave
- 1039 Channing Way
- 1728 Curtis St
- 2324 Browning St
- 817 Delaware St
- 995 Virginia St
- 1631 Belvedere Ave
- 1092 Dwight Way
- 1029 Addison St
- 1035 Addison St
- 2021 10th St
- 1019 Addison St
- 1028 Addison St
- 1015 Addison St
- 1026 Addison St
- 2020 10th St
- 2072 San Pablo Ave
- 1030 Addison St
- 1013 Addison St
- 1036 Addison St
- 1020 Addison St
- 2054 San Pablo Ave
- 2016 10th St
- 2012 10th St
- 1016 Addison St
- 2010 10th St
- 1012 Addison St
- 2113 10th St
Your Personal Tour Guide
Ask me questions while you tour the home.