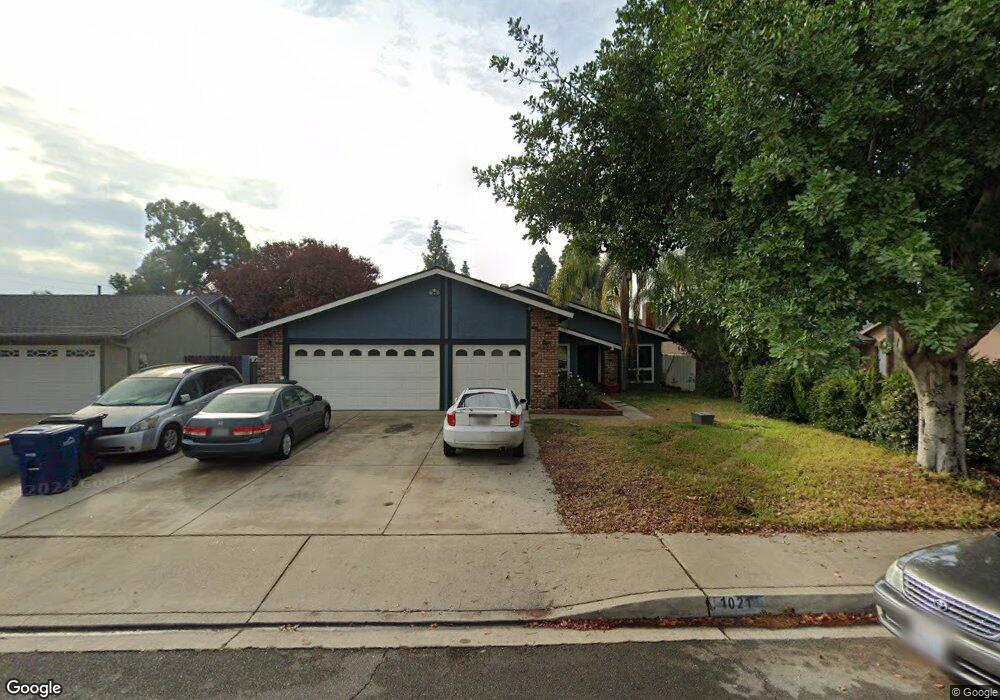
1021 Maple Ct Ontario, CA 91762
Downtown Ontario NeighborhoodEstimated Value: $703,607 - $763,000
4
Beds
2
Baths
1,540
Sq Ft
$471/Sq Ft
Est. Value
About This Home
This home is located at 1021 Maple Ct, Ontario, CA 91762 and is currently estimated at $725,652, approximately $471 per square foot. 1021 Maple Ct is a home located in San Bernardino County with nearby schools including Vista Grande Elementary School, Oaks Middle, and Ontario High School.
Ownership History
Date
Name
Owned For
Owner Type
Purchase Details
Closed on
Aug 24, 2005
Sold by
Rabago Jose Martin
Bought by
Moreno Wendy Minerva
Current Estimated Value
Home Financials for this Owner
Home Financials are based on the most recent Mortgage that was taken out on this home.
Original Mortgage
$198,000
Outstanding Balance
$103,878
Interest Rate
5.64%
Mortgage Type
New Conventional
Estimated Equity
$621,774
Purchase Details
Closed on
Sep 13, 1999
Sold by
Hud
Bought by
Rabago Jose Martin and Moreno Wendy Minerva
Home Financials for this Owner
Home Financials are based on the most recent Mortgage that was taken out on this home.
Original Mortgage
$132,863
Interest Rate
7.97%
Mortgage Type
FHA
Purchase Details
Closed on
Jul 7, 1999
Sold by
Norwest Mtg Inc
Bought by
Hud
Purchase Details
Closed on
Jun 7, 1999
Sold by
Tejeda Luis A
Bought by
Norwest Mtg Inc
Create a Home Valuation Report for This Property
The Home Valuation Report is an in-depth analysis detailing your home's value as well as a comparison with similar homes in the area
Home Values in the Area
Average Home Value in this Area
Purchase History
| Date | Buyer | Sale Price | Title Company |
|---|---|---|---|
| Moreno Wendy Minerva | -- | Chicago Title Company | |
| Rabago Jose Martin | $132,000 | Gateway Title Company | |
| Hud | -- | Fidelity National Title Ins | |
| Norwest Mtg Inc | $145,116 | Fidelity National Title Ins |
Source: Public Records
Mortgage History
| Date | Status | Borrower | Loan Amount |
|---|---|---|---|
| Open | Moreno Wendy Minerva | $198,000 | |
| Closed | Rabago Jose Martin | $132,863 |
Source: Public Records
Tax History
| Year | Tax Paid | Tax Assessment Tax Assessment Total Assessment is a certain percentage of the fair market value that is determined by local assessors to be the total taxable value of land and additions on the property. | Land | Improvement |
|---|---|---|---|---|
| 2025 | $2,310 | $202,204 | $61,483 | $140,721 |
| 2024 | $2,259 | $198,239 | $60,277 | $137,962 |
| 2023 | $2,198 | $194,352 | $59,095 | $135,257 |
| 2022 | $2,171 | $190,541 | $57,936 | $132,605 |
| 2021 | $2,157 | $186,805 | $56,800 | $130,005 |
| 2020 | $2,121 | $184,890 | $56,218 | $128,672 |
| 2019 | $2,104 | $181,265 | $55,116 | $126,149 |
| 2018 | $2,076 | $177,710 | $54,035 | $123,675 |
| 2017 | $2,004 | $174,225 | $52,975 | $121,250 |
| 2016 | $1,928 | $170,809 | $51,936 | $118,873 |
| 2015 | $1,916 | $168,243 | $51,156 | $117,087 |
| 2014 | $1,860 | $164,947 | $50,154 | $114,793 |
Source: Public Records
Map
Nearby Homes
- 1034 Maple Ct
- 1726 S Mountain Ave Unit C
- 1742 S Mountain Ave Unit E
- 1604 S Mountain Ave Unit D
- 908 W Linden St
- 1725 S Elderberry St
- 1417 S Magnolia Ave
- 2015 S Mountain Ave
- 1027 Eclipse Ct
- 0 W Phillips St
- 1546 Redwood Ave
- 1209 S Palmetto Ave Unit C
- 1230 S Cypress Ave
- 1216 S Cypress Ave Unit E
- 1218 S Cypress Ave Unit B
- 1106 W Philadelphia St
- 926 W Philadelphia St Unit 41
- 926 W Philadelphia St Unit Q93
- 926 W Philadelphia St Unit 57
- 1158 W Philadelphia St
- 1027 Maple Ct
- 1015 Maple Ct
- 1703 Pine Place
- 1702 Pine Place
- 1009 Maple Ct
- 1033 Maple Ct
- 1709 Pine Place
- 1022 Maple Ct
- 1039 Maple Ct
- 1003 Maple Ct
- 1016 Maple Ct
- 1028 Maple Ct
- 1702 S Palmetto Ave
- 1708 Pine Place
- 1010 Maple Ct
- 1708 S Palmetto Ave
- 1715 Pine Place
- 1004 Maple Ct
- 1714 Pine Place
- 1040 Maple Ct
Your Personal Tour Guide
Ask me questions while you tour the home.