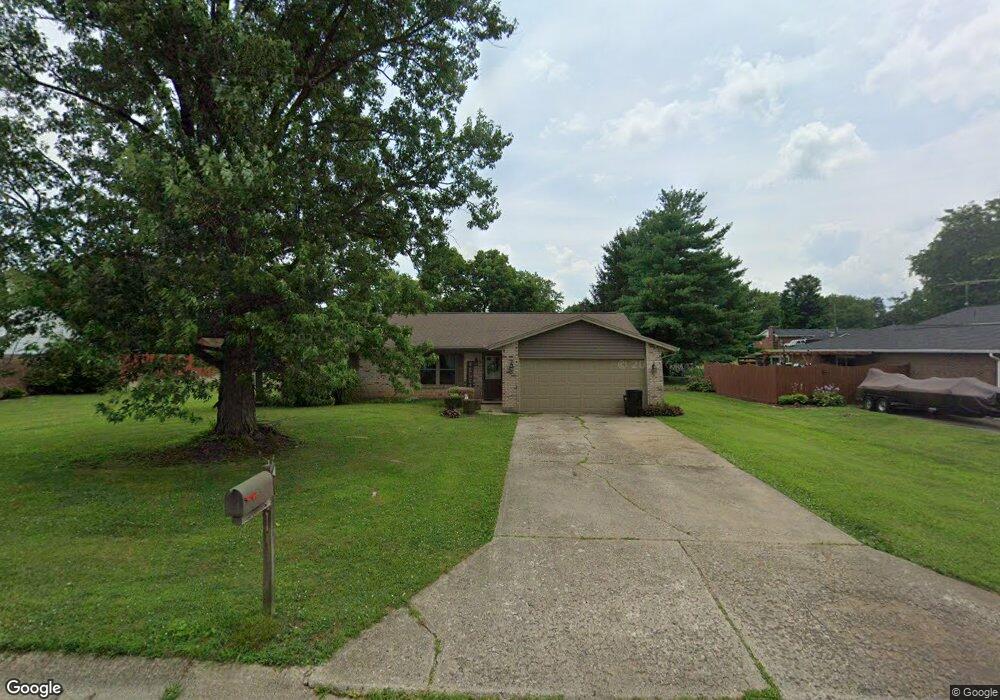
1021 Mount Dr Franklin, OH 45005
Estimated Value: $241,000 - $274,000
3
Beds
2
Baths
1,562
Sq Ft
$163/Sq Ft
Est. Value
About This Home
This home is located at 1021 Mount Dr, Franklin, OH 45005 and is currently estimated at $255,215, approximately $163 per square foot. 1021 Mount Dr is a home located in Warren County with nearby schools including Alden R Brown Elementary School, Chamberlain Middle School, and Carlisle High School.
Ownership History
Date
Name
Owned For
Owner Type
Purchase Details
Closed on
Jul 26, 2017
Sold by
Saylor Jeremy J and Saylor Andrea A
Bought by
Saylor Jillian N
Current Estimated Value
Purchase Details
Closed on
Oct 12, 2009
Sold by
Estate Of Mary Charlotte Blistan
Bought by
Saylor Penny S
Purchase Details
Closed on
Feb 28, 2007
Sold by
Crone Jerry L and Crone Lee Ann
Bought by
Blistan Mary
Purchase Details
Closed on
Aug 2, 1995
Sold by
Mcmurchy Gary L
Bought by
Crone Jerry L and Crone Lee A
Home Financials for this Owner
Home Financials are based on the most recent Mortgage that was taken out on this home.
Original Mortgage
$88,701
Interest Rate
7.56%
Mortgage Type
FHA
Purchase Details
Closed on
Apr 30, 1993
Sold by
Rogers Rogers and Rogers Billy W
Bought by
Mcmurchy and Mcmurchy Gary L
Purchase Details
Closed on
Mar 9, 1987
Sold by
Holliday Gary A and Holliday Sandr
Bought by
Rogers and Billy W
Create a Home Valuation Report for This Property
The Home Valuation Report is an in-depth analysis detailing your home's value as well as a comparison with similar homes in the area
Home Values in the Area
Average Home Value in this Area
Purchase History
| Date | Buyer | Sale Price | Title Company |
|---|---|---|---|
| Saylor Jillian N | -- | None Available | |
| Saylor Penny S | -- | Middletown Title | |
| Blistan Mary | $110,000 | National Title Co | |
| Crone Jerry L | $89,900 | -- | |
| Mcmurchy | -- | -- | |
| Rogers | $58,000 | -- |
Source: Public Records
Mortgage History
| Date | Status | Borrower | Loan Amount |
|---|---|---|---|
| Previous Owner | Crone Jerry L | $88,701 |
Source: Public Records
Tax History
| Year | Tax Paid | Tax Assessment Tax Assessment Total Assessment is a certain percentage of the fair market value that is determined by local assessors to be the total taxable value of land and additions on the property. | Land | Improvement |
|---|---|---|---|---|
| 2025 | $2,698 | $70,430 | $17,850 | $52,580 |
| 2024 | $2,698 | $70,430 | $17,850 | $52,580 |
| 2023 | $2,183 | $51,481 | $11,151 | $40,330 |
| 2022 | $2,169 | $51,482 | $11,151 | $40,331 |
| 2021 | $2,094 | $51,482 | $11,151 | $40,331 |
| 2020 | $2,033 | $43,628 | $9,450 | $34,178 |
| 2019 | $2,032 | $43,628 | $9,450 | $34,178 |
| 2018 | $2,038 | $43,628 | $9,450 | $34,178 |
| 2017 | $1,966 | $37,489 | $8,250 | $29,239 |
| 2016 | $1,725 | $37,489 | $8,250 | $29,239 |
| 2015 | $865 | $37,489 | $8,250 | $29,239 |
| 2014 | $844 | $36,400 | $8,010 | $28,390 |
| 2013 | $1,664 | $47,730 | $10,500 | $37,230 |
Source: Public Records
Map
Nearby Homes
- 120 Cousins Dr
- 163 Wolf Creek Ct
- 175 Nikki Ct
- 533 Clay St
- 571 Elm Dr
- 121 Mound Builder Place
- 1223 Waterbury Dr
- 1215 Waterbury Dr
- 1221 Waterbury Dr
- 90 Timber Creek Dr
- 7958 Dubois Rd
- 220 Auburn Meadows Ct
- 8782 Alyce St
- 0 Farmington Rd Unit 1775475
- 1095 Marty Lee Ln
- 7548 Timber Valley Dr
- 730 Park Ave
- 7368 Timber Wolf Dr
- 712 Abney Ln
- 5711 Fairview Dr
- 1011 Mount Dr
- 1031 Mount Dr
- 1001 Mount Dr
- 1041 Mount Dr
- 7430 Red Robin St
- 7450 Red Robin St
- 1030 Mount Dr
- 7412 Red Robin St
- 1020 Mount Dr
- 1010 Mount Dr
- 330 Lantis Dr
- 7472 Red Robin St
- 991 Mount Dr
- 351 Lantis Dr
- 7490 Red Robin St
- 320 Lantis Dr
- 981 Mount Dr
- 311 Welcome Way
- 230 Ethelrob Cir
- 341 Lantis Dr
Your Personal Tour Guide
Ask me questions while you tour the home.