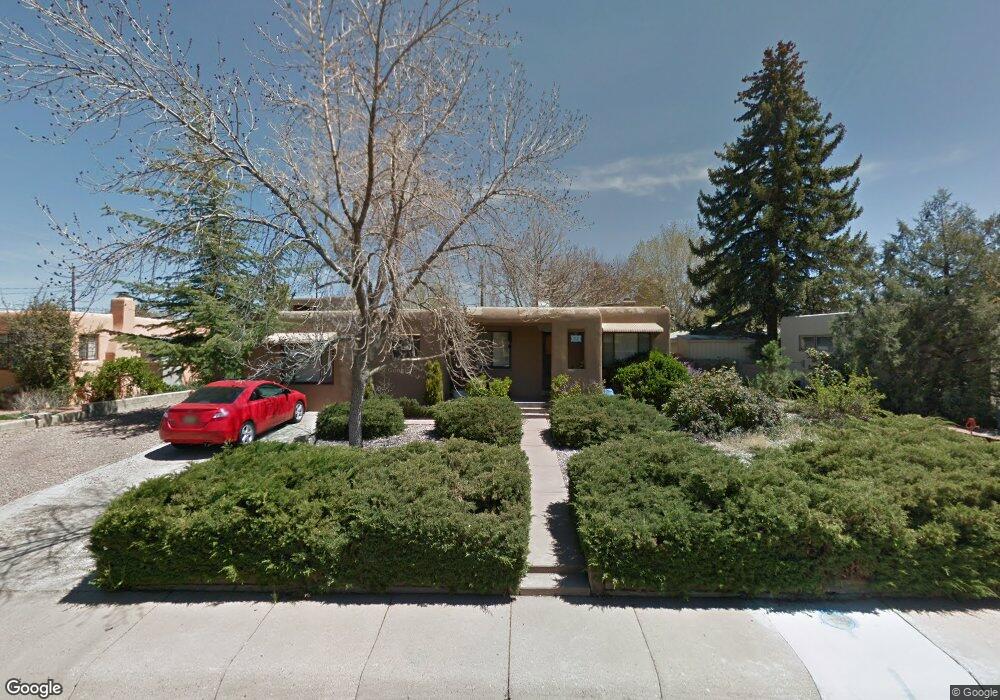
1021 Osage Cir Santa Fe, NM 87505
Casa Alegre NeighborhoodEstimated Value: $536,000 - $579,000
3
Beds
2
Baths
1,528
Sq Ft
$362/Sq Ft
Est. Value
About This Home
This home is located at 1021 Osage Cir, Santa Fe, NM 87505 and is currently estimated at $552,722, approximately $361 per square foot. 1021 Osage Cir is a home located in Santa Fe County with nearby schools including Salazar Elementary School, Milagro Middle School, and Santa Fe High School.
Ownership History
Date
Name
Owned For
Owner Type
Purchase Details
Closed on
Jan 26, 2024
Sold by
Hunter Tara A
Bought by
Marohn Felicia
Current Estimated Value
Purchase Details
Closed on
Sep 11, 2015
Sold by
1021 Osage Circle
Bought by
Marohn Felicia and Hunter Tara A
Home Financials for this Owner
Home Financials are based on the most recent Mortgage that was taken out on this home.
Original Mortgage
$224,000
Interest Rate
4.03%
Mortgage Type
New Conventional
Purchase Details
Closed on
Jul 1, 2014
Sold by
Apfel Horst and Apfel Lilo
Bought by
1021 Osage Circle Llc
Purchase Details
Closed on
Jun 30, 2005
Sold by
Wilwin Asset Managment Corp
Bought by
Apfel Horst and Apfel Lilo
Purchase Details
Closed on
Jun 18, 2005
Sold by
Apfel Horst and Apfel Lilo
Bought by
Wilwin Asset Management Corp
Purchase Details
Closed on
Feb 27, 2004
Sold by
Evers Dona L
Bought by
Horst & Lilo Apfel Qualified Domestic Re
Create a Home Valuation Report for This Property
The Home Valuation Report is an in-depth analysis detailing your home's value as well as a comparison with similar homes in the area
Home Values in the Area
Average Home Value in this Area
Purchase History
| Date | Buyer | Sale Price | Title Company |
|---|---|---|---|
| Marohn Felicia | -- | None Listed On Document | |
| Marohn Felicia | -- | Fidelity Natl Title Of New M | |
| 1021 Osage Circle Llc | -- | None Available | |
| Apfel Horst | -- | None Available | |
| Wilwin Asset Management Corp | -- | -- | |
| Horst & Lilo Apfel Qualified Domestic Re | -- | -- |
Source: Public Records
Mortgage History
| Date | Status | Borrower | Loan Amount |
|---|---|---|---|
| Previous Owner | Marohn Felicia | $224,000 |
Source: Public Records
Tax History Compared to Growth
Tax History
| Year | Tax Paid | Tax Assessment Tax Assessment Total Assessment is a certain percentage of the fair market value that is determined by local assessors to be the total taxable value of land and additions on the property. | Land | Improvement |
|---|---|---|---|---|
| 2024 | $2,414 | $316,814 | $96,828 | $219,986 |
| 2023 | $2,414 | $307,587 | $94,008 | $213,579 |
| 2022 | $2,361 | $298,629 | $94,008 | $204,621 |
| 2021 | $2,324 | $96,644 | $30,960 | $65,684 |
| 2020 | $2,255 | $93,829 | $30,058 | $63,771 |
| 2019 | $2,223 | $91,097 | $29,183 | $61,914 |
| 2018 | $2,174 | $88,444 | $28,333 | $60,111 |
| 2017 | $2,120 | $85,868 | $28,333 | $57,535 |
| 2016 | $1,999 | $83,366 | $28,333 | $55,033 |
| 2015 | $1,432 | $59,363 | $18,333 | $41,030 |
| 2014 | $1,288 | $55,092 | $18,315 | $36,777 |
Source: Public Records
Map
Nearby Homes
- 965 Osage Ave
- 2043 Hopi Rd
- 944 Camino Oraibi
- 1222 Vitalia St
- 2441 Calle Linda
- 500 Camino Solano
- 506 Barela Ln
- 1304 Montoya Place
- 1820 Kiva Rd
- 960 Acequia de Las Joyas
- 947 & 949 Acequia de Las Joyas
- 1268 Maez Rd
- 1907 Chamisa St
- 1113 Paseo Corazon Unit 203
- 1141 Harrison Rd
- 2804 Isaiah Ln
- 2200 W Alameda St
- 933 Nicole Place
- 232 Delfina St
- 222 Delfina St
- 1015 Osage Cir
- 1027 Osage Cir
- 1077 Osage Cir
- 1008 Osage Ave
- 1012 Osage Ave
- 1036 Osage Cir
- 1042 Osage Cir
- 1004 Osage Ave
- 1032 Osage Cir
- 1046 Osage Cir
- 1028 Osage Cir
- 1052 Osage Cir
- 1003 Osage Cir
- 1100 Osage Ave
- 1024 Osage Cir
- 1082 Osage Cir
- 1009 Osage Ave
- 1076 Osage Cir
- 1013 Camino de Chelly
- 1009 Camino de Chelly