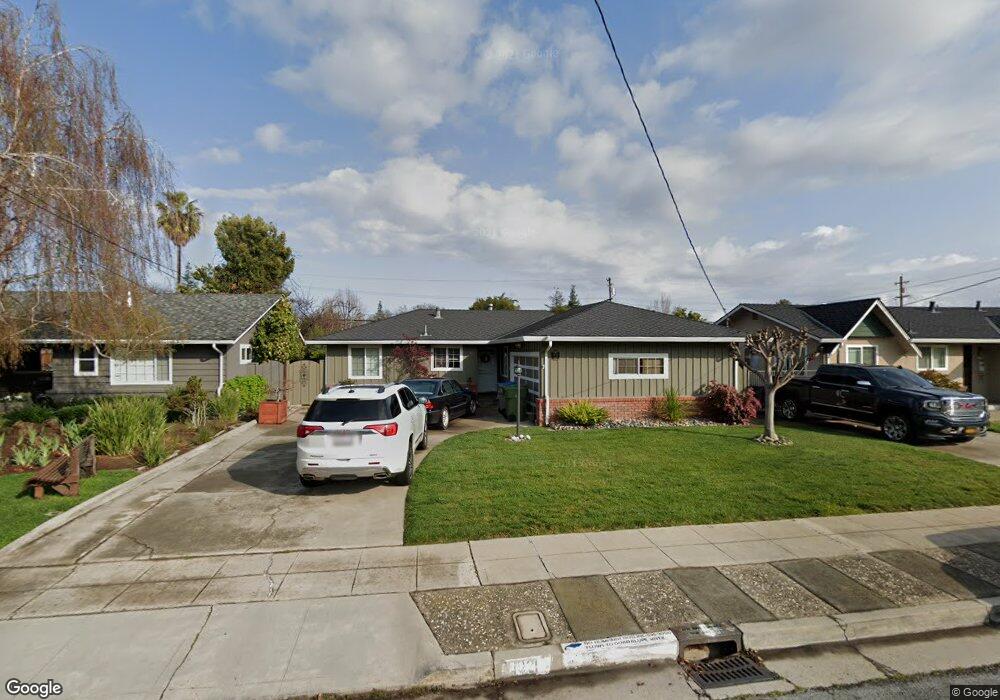
1021 Pascoe Ave San Jose, CA 95125
Willow Glen NeighborhoodEstimated Value: $1,401,129 - $1,919,000
3
Beds
2
Baths
1,281
Sq Ft
$1,247/Sq Ft
Est. Value
About This Home
This home is located at 1021 Pascoe Ave, San Jose, CA 95125 and is currently estimated at $1,598,032, approximately $1,247 per square foot. 1021 Pascoe Ave is a home located in Santa Clara County with nearby schools including Booksin Elementary, Willow Glen Middle, and Willow Glen High School.
Ownership History
Date
Name
Owned For
Owner Type
Purchase Details
Closed on
Mar 7, 2013
Sold by
Spadafore Irene and Pimentel Kelly
Bought by
Pimentel Kelly and Spadafore Irene
Current Estimated Value
Home Financials for this Owner
Home Financials are based on the most recent Mortgage that was taken out on this home.
Original Mortgage
$166,000
Interest Rate
3.53%
Mortgage Type
New Conventional
Purchase Details
Closed on
Oct 14, 2009
Sold by
Pimentel Kelly and Spadafore Irene
Bought by
Spadafore Irene and Pimentel Kelly
Home Financials for this Owner
Home Financials are based on the most recent Mortgage that was taken out on this home.
Original Mortgage
$175,000
Interest Rate
5.05%
Mortgage Type
New Conventional
Purchase Details
Closed on
Oct 1, 2008
Sold by
Spadafore Irene and Pimentel Kelly
Bought by
Spadafore Irene and Pimentel Kelly
Purchase Details
Closed on
Jul 12, 2000
Sold by
Spadafore Octavius And Irene Trustee
Bought by
Spadafore Octavius and Spadafore Irene
Create a Home Valuation Report for This Property
The Home Valuation Report is an in-depth analysis detailing your home's value as well as a comparison with similar homes in the area
Home Values in the Area
Average Home Value in this Area
Purchase History
| Date | Buyer | Sale Price | Title Company |
|---|---|---|---|
| Pimentel Kelly | -- | Lsi Title Company | |
| Spadafore Irene | -- | Accommodation | |
| Spadafore Irene | -- | Accommodation | |
| Pimentel Kelly | -- | Chicago Title Company | |
| Spadafore Irene | -- | None Available | |
| Spadafore Octavius | $265,000 | Commonwealth Land Title Co |
Source: Public Records
Mortgage History
| Date | Status | Borrower | Loan Amount |
|---|---|---|---|
| Closed | Pimentel Kelly | $166,000 | |
| Closed | Pimentel Kelly | $175,000 |
Source: Public Records
Tax History Compared to Growth
Tax History
| Year | Tax Paid | Tax Assessment Tax Assessment Total Assessment is a certain percentage of the fair market value that is determined by local assessors to be the total taxable value of land and additions on the property. | Land | Improvement |
|---|---|---|---|---|
| 2025 | $7,090 | $488,659 | $372,318 | $116,341 |
| 2024 | $7,090 | $479,078 | $365,018 | $114,060 |
| 2023 | $6,929 | $469,685 | $357,861 | $111,824 |
| 2022 | $6,857 | $460,477 | $350,845 | $109,632 |
| 2021 | $6,679 | $451,449 | $343,966 | $107,483 |
| 2020 | $6,502 | $446,821 | $340,440 | $106,381 |
| 2019 | $6,345 | $438,061 | $333,765 | $104,296 |
| 2018 | $6,266 | $429,472 | $327,221 | $102,251 |
| 2017 | $6,207 | $421,052 | $320,805 | $100,247 |
| 2016 | $6,047 | $412,797 | $314,515 | $98,282 |
| 2015 | $1,791 | $63,200 | $19,584 | $43,616 |
| 2014 | $1,321 | $61,963 | $19,201 | $42,762 |
Source: Public Records
Map
Nearby Homes
- 1028 Pascoe Ave
- 1027 Shenandoah Dr
- 1105 Lincoln Ct
- 1109 Lincoln Ct
- 2265 Mazzaglia Ave
- 1247 Curtner Ave
- 2059 Jonathan Ave
- 867 Ironwood Dr
- 2206 Almaden Rd Unit B
- 2296 Almaden Rd Unit B
- 2114 Ardis Dr
- 1037 Hazelwood Ave
- 2150 Almaden Rd Unit 147
- 2150 Almaden Rd
- 2150 Almaden Rd Unit 103
- 2070 Almaden Rd
- 847 Wren Dr
- 2598 Cottle Ave
- 2128 Canoas Garden Ave Unit D
- 940 Sunbonnet Loop
- 1015 Pascoe Ave
- 1029 Pascoe Ave
- 1012 Curtner Ave
- 999 Pascoe Ave
- 1037 Pascoe Ave
- 1022 Curtner Ave
- 1008 Curtner Ave
- 1032 Curtner Ave
- 1020 Pascoe Ave
- 1004 Curtner Ave
- 1012 Pascoe Ave
- 995 Pascoe Ave
- 1043 Pascoe Ave
- 1002 Pascoe Ave
- 1036 Pascoe Ave
- 1040 Curtner Ave
- 1002 Curtner Ave
- 1051 Pascoe Ave
- 983 Pascoe Ave
- 992 Pascoe Ave