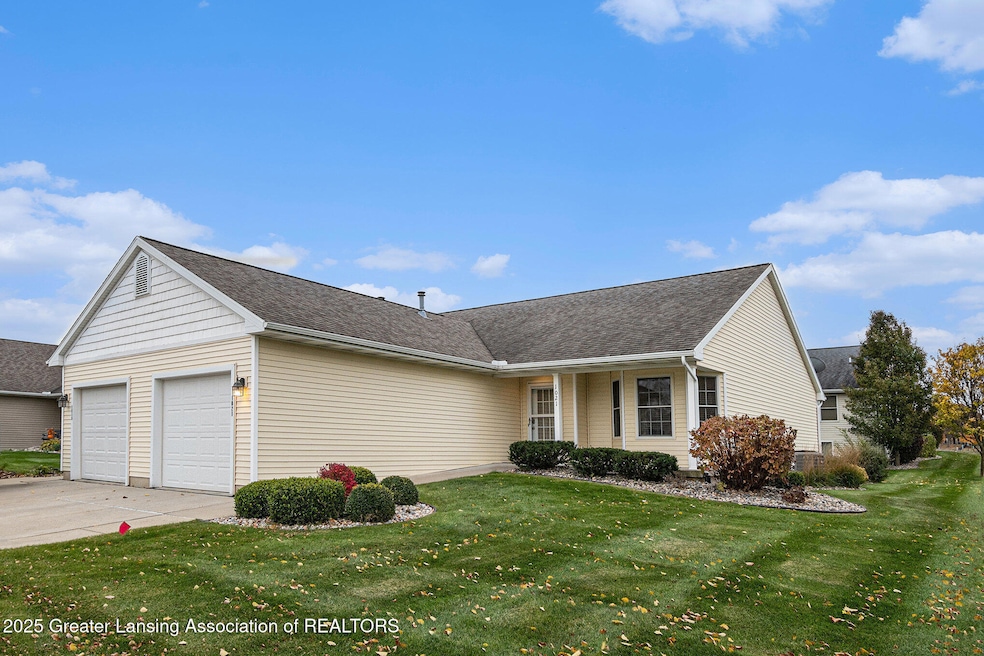
1021 Randy Ln Unit 34 Saint Johns, MI 48879
Estimated payment $1,926/month
Highlights
- Open Floorplan
- Vaulted Ceiling
- Neighborhood Views
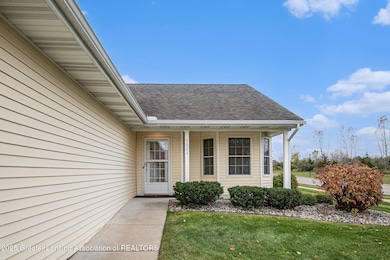
- Deck
- Corner Lot
- 1 Car Attached Garage
About This Home
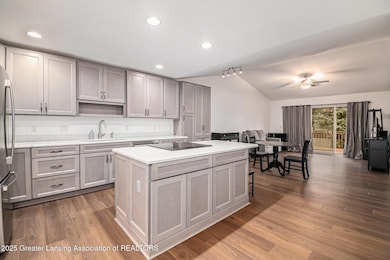
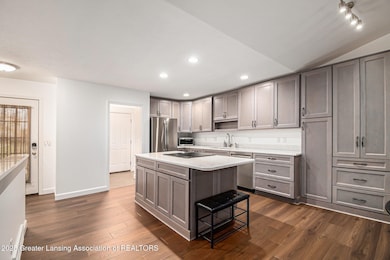
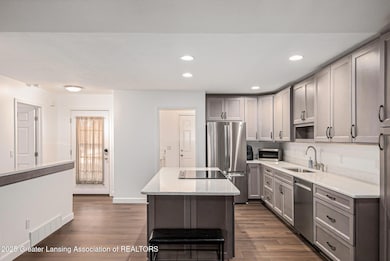
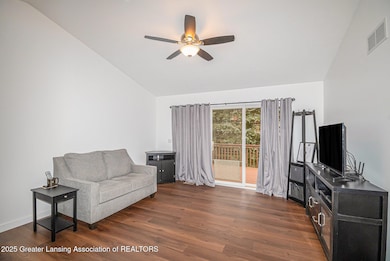
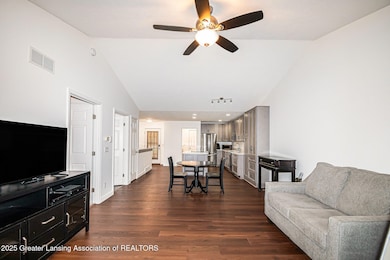
Condo living at its finest in Clover Ridge Condominiums! Beautifully updated 2-bedroom, 1-bath ranch-style condo offering comfort, style, and convenience. The open floor plan features cathedral ceilings, recessed lighting, and Coretec Premium plank flooring throughout the main living areas, creating a bright and airy atmosphere perfect for everyday living and entertaining. The custom kitchen is a standout with quartz countertops, a large island with bar seating, abundant cabinet space, and new stainless-steel appliances (2022). Seamless flow into the dining and living areas makes this home ideal for gatherings and easy conversation. Both bedrooms feature new carpet (2022), and the bathroom and laundry area include vinyl flooring for durability and style. The full basement is ready to be finished, complete with an egress window and bathroom stub-in, offering the opportunity for additional living space. Recent updates include new central air and thermostat (2025), water softener, hot water heater, sump pump, washer and dryer (2022), along with added ceiling fans and recessed lighting throughout. This well maintained condo combines modern finishes with low-maintenance living. Take a 12 minute stroll to the Fred Meijer trail that leads to the north end of town where you can find shopping, dining, and parks! Don't miss this opportunity, schedule your showing today!
Property Details
Home Type
- Condominium
Est. Annual Taxes
- $2,747
Year Built
- Built in 2007
Lot Details
- Landscaped
- Front Yard
HOA Fees
- $250 Monthly HOA Fees
Parking
- 1 Car Attached Garage
- Side Facing Garage
- Garage Door Opener
- Shared Driveway
Home Design
- Shingle Roof
- Vinyl Siding
Interior Spaces
- 1,065 Sq Ft Home
- 1-Story Property
- Open Floorplan
- Vaulted Ceiling
- Ceiling Fan
- Recessed Lighting
- Track Lighting
- Bay Window
- Neighborhood Views
Kitchen
- Oven
- Range
- Dishwasher
- Disposal
Flooring
- Carpet
- Vinyl
Bedrooms and Bathrooms
- 2 Bedrooms
- Dual Closets
- 1 Full Bathroom
- Humidity Controlled
Laundry
- Laundry on main level
- Dryer
- Washer
Basement
- Basement Fills Entire Space Under The House
- Sump Pump
- Stubbed For A Bathroom
- Basement Window Egress
Outdoor Features
- Deck
- Rain Gutters
Utilities
- Forced Air Heating and Cooling System
- Heating System Uses Natural Gas
- Natural Gas Connected
- Water Softener is Owned
Community Details
Overview
- Association fees include snow removal, liability insurance, lawn care, exterior maintenance
- Clover Ridge Association
- Clover Ridge Subdivision
Recreation
- Snow Removal
Map
Home Values in the Area
Average Home Value in this Area
Tax History
| Year | Tax Paid | Tax Assessment Tax Assessment Total Assessment is a certain percentage of the fair market value that is determined by local assessors to be the total taxable value of land and additions on the property. | Land | Improvement |
|---|---|---|---|---|
| 2025 | $4,249 | $106,700 | $17,500 | $89,200 |
| 2024 | $2,900 | $102,700 | $15,000 | $87,700 |
| 2023 | $2,728 | $97,900 | $0 | $0 |
| 2022 | $3,039 | $82,100 | $15,000 | $67,100 |
| 2021 | $2,965 | $75,600 | $12,500 | $63,100 |
| 2020 | $2,864 | $72,900 | $12,500 | $60,400 |
| 2019 | $2,774 | $68,500 | $12,500 | $56,000 |
| 2018 | $2,599 | $67,200 | $12,500 | $54,700 |
| 2017 | -- | $68,200 | $12,500 | $55,700 |
| 2016 | $2,715 | $64,900 | $12,500 | $52,400 |
| 2015 | -- | $57,400 | $0 | $0 |
| 2011 | -- | $64,400 | $0 | $0 |
Property History
| Date | Event | Price | List to Sale | Price per Sq Ft |
|---|---|---|---|---|
| 11/04/2025 11/04/25 | For Sale | $274,900 | -- | $258 / Sq Ft |
Purchase History
| Date | Type | Sale Price | Title Company |
|---|---|---|---|
| Warranty Deed | $210,000 | Transnation Title | |
| Warranty Deed | $137,000 | None Available | |
| Warranty Deed | $125,000 | None Available | |
| Interfamily Deed Transfer | -- | None Available | |
| Interfamily Deed Transfer | -- | None Available | |
| Warranty Deed | $20,000 | First American Title Company |
Source: Greater Lansing Association of Realtors®
MLS Number: 292413
APN: 300-151-000-034-00
Disclaimer: Certain information contained herein is derived from information provided by parties other than Homes.com. All information provided is deemed reliable, but is not guaranteed to be accurate and should be independently verified.
![]() IDX information is provided exclusively for Consumers'
IDX information is provided exclusively for Consumers'
personal, non-commercial use, that it may not be used for any purpose other than to identify prospective properties Consumers may be interested in purchasing. Data is deemed reliable but is not guaranteed accurate by the MLS.
Copyright © 2025 Greater Lansing Association of REALTORS®
- 810 Joyce Ln
- 808 Joyce Ln Unit 14
- 808 Joyce Ln
- 810 Joyce Ln Unit 13
- 912 Randy Ln Unit 6
- 705 N Us127
- 606 E Railroad St
- 715 N Clinton Ave
- 306 S Swegles St
- 204 N Whittemore St
- 301 E Walker St
- 905 N Lansing St
- 823 N Lansing St
- 903 E State St
- 1455 W Hyde Rd
- 408 Vauconsant St
- 505 Euclid St
- 606 W Gibbs St
- 608 N Morton St
- 410 W Baldwin St
- 900-906 E Sturgis St
- 1111 Astwood Mews Ln Unit 1
- 1220 Sunview Dr
- 300 Riverwind Dr
- 13132 Addington Dr
- 1101 W Twinbrook Dr
- 13180 Schavey Rd
- 1268 W Clark Rd
- 1320 Clarion Rd
- 3505 W Clark Rd
- 140 W North St
- 14690 Abbey Ln
- 15240 Red Tail Dr
- 4060 Springer Way
- 85 Nettie Ave Unit 85
- 109 Desander Dr Unit 109
- 117 Desander Dr Unit 117
- 3945 Hunsaker Dr
- 3939 Hunsaker Dr
- 3636 Coleman Rd
