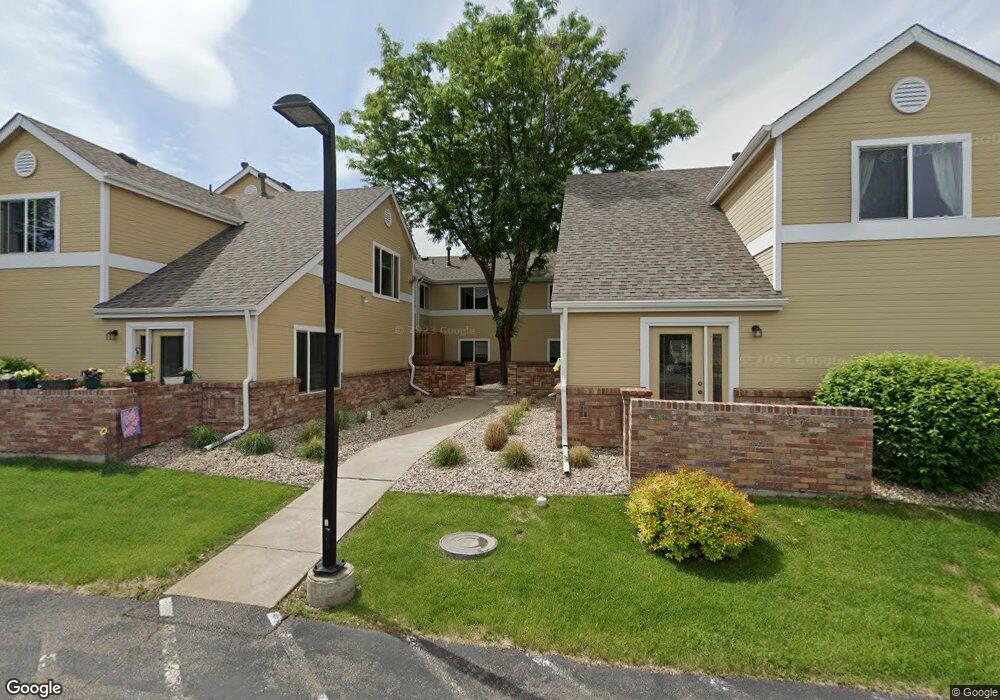
1021 Rolland Moore Dr Unit 5A Fort Collins, CO 80526
Estimated Value: $265,000 - $322,000
1
Bed
1
Bath
720
Sq Ft
$409/Sq Ft
Est. Value
About This Home
This home is located at 1021 Rolland Moore Dr Unit 5A, Fort Collins, CO 80526 and is currently estimated at $294,420, approximately $408 per square foot. 1021 Rolland Moore Dr Unit 5A is a home located in Larimer County with nearby schools including Bennett Elementary School, Blevins Middle School, and Rocky Mountain High School.
Ownership History
Date
Name
Owned For
Owner Type
Purchase Details
Closed on
Jul 22, 2025
Sold by
Gauna Gerald William
Bought by
Gerald Gauna Living Trust and Gauna
Current Estimated Value
Purchase Details
Closed on
May 21, 2004
Sold by
Fisher Gregory and Fisher Patricia
Bought by
Gauna Gerald William and Gauna Maryrose
Home Financials for this Owner
Home Financials are based on the most recent Mortgage that was taken out on this home.
Original Mortgage
$94,400
Interest Rate
5.99%
Mortgage Type
Purchase Money Mortgage
Purchase Details
Closed on
Jul 21, 2000
Sold by
Windtrail Llc
Bought by
Fisher Gregory and Fisher Patricia
Home Financials for this Owner
Home Financials are based on the most recent Mortgage that was taken out on this home.
Original Mortgage
$82,200
Interest Rate
8.36%
Mortgage Type
FHA
Create a Home Valuation Report for This Property
The Home Valuation Report is an in-depth analysis detailing your home's value as well as a comparison with similar homes in the area
Home Values in the Area
Average Home Value in this Area
Purchase History
| Date | Buyer | Sale Price | Title Company |
|---|---|---|---|
| Gerald Gauna Living Trust | -- | None Listed On Document | |
| Gauna Gerald William | $118,000 | Guardian Title Agency | |
| Fisher Gregory | $84,200 | Land Title |
Source: Public Records
Mortgage History
| Date | Status | Borrower | Loan Amount |
|---|---|---|---|
| Previous Owner | Gauna Gerald William | $94,400 | |
| Previous Owner | Fisher Gregory | $82,200 |
Source: Public Records
Tax History Compared to Growth
Tax History
| Year | Tax Paid | Tax Assessment Tax Assessment Total Assessment is a certain percentage of the fair market value that is determined by local assessors to be the total taxable value of land and additions on the property. | Land | Improvement |
|---|---|---|---|---|
| 2025 | $1,591 | $20,261 | $6,097 | $14,164 |
| 2024 | $1,513 | $20,261 | $6,097 | $14,164 |
| 2022 | $1,551 | $16,423 | $1,946 | $14,477 |
| 2021 | $1,567 | $16,895 | $2,002 | $14,893 |
| 2020 | $1,525 | $16,302 | $2,002 | $14,300 |
| 2019 | $1,532 | $16,302 | $2,002 | $14,300 |
| 2018 | $1,222 | $13,406 | $2,016 | $11,390 |
| 2017 | $1,218 | $13,406 | $2,016 | $11,390 |
| 2016 | $941 | $10,308 | $2,229 | $8,079 |
| 2015 | $934 | $10,310 | $2,230 | $8,080 |
| 2014 | $821 | $9,000 | $2,230 | $6,770 |
Source: Public Records
Map
Nearby Homes
- 1021 Rolland Moore Dr Unit F
- 1021 Rolland Moore Dr Unit 5
- 1112 Evenstar Ct
- 960 Shire Ct
- 1935 Waters Edge St Unit F
- 1935 Waters Edge St Unit C
- 906 Shire Ct
- 848 Shire Ct
- 1841 Wallenberg Dr
- 1300 W Stuart St Unit 23
- 818 Wagonwheel Dr
- 1333 Village Park Ct
- 1928 Wallenberg Dr
- 1929 Sheely Dr
- 1225 W Prospect Rd Unit R47
- 1419 Glen Haven Dr
- 1000 W Prospect Rd
- 1701 Glenwood Dr
- 2109 W Drake Rd
- 1308 W Prospect Rd
- 1021 Rolland Moore Dr Unit 5H
- 1021 Rolland Moore Dr Unit 5G
- 1021 Rolland Moore Dr Unit 5F
- 1021 Rolland Moore Dr Unit 5E
- 1021 Rolland Moore Dr Unit 5D
- 1021 Rolland Moore Dr Unit 5C
- 1021 Rolland Moore Dr Unit 5B
- 1021 Rolland Moore Dr Unit 6H
- 1021 Rolland Moore Dr Unit 6G
- 1021 Rolland Moore Dr Unit 6F
- 1021 Rolland Moore Dr Unit 6E
- 1021 Rolland Moore Dr Unit 6D
- 1021 Rolland Moore Dr Unit 6C
- 1021 Rolland Moore Dr Unit 6B
- 1021 Rolland Moore Dr Unit 6A
- 1021 Rolland Moore Dr Unit 7H
- 1021 Rolland Moore Dr Unit 7G
- 1021 Rolland Moore Dr Unit 7F
- 1021 Rolland Moore Dr Unit 7E
- 1021 Rolland Moore Dr Unit 7D