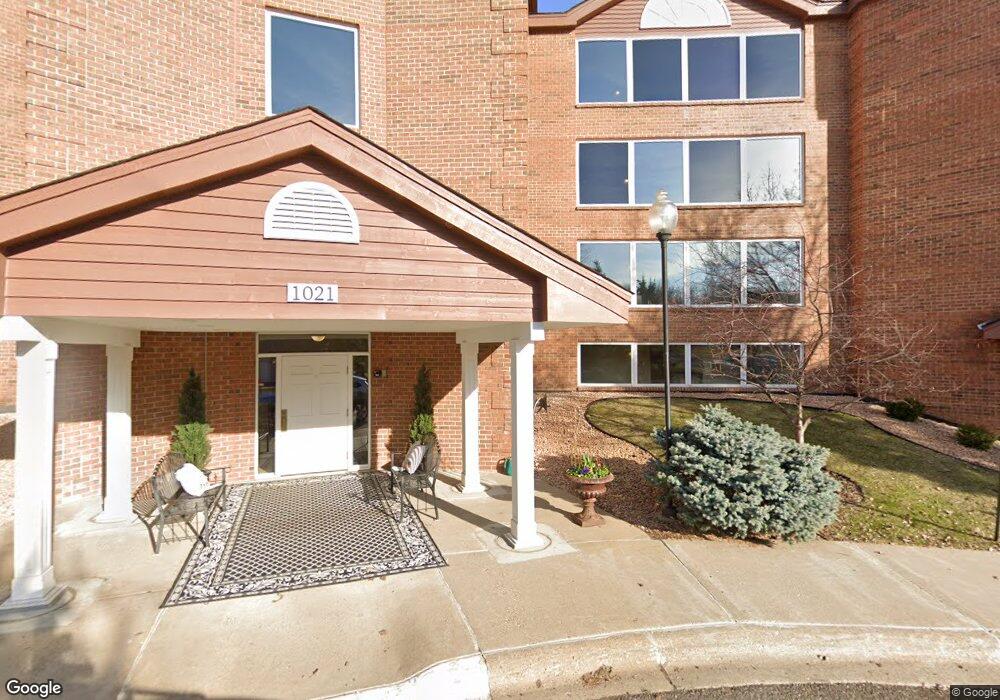
1021 Sibley Mem Hwy Unit 301 Saint Paul, MN 55118
Estimated Value: $503,000 - $630,000
2
Beds
2
Baths
2,284
Sq Ft
$239/Sq Ft
Est. Value
About This Home
This home is located at 1021 Sibley Mem Hwy Unit 301, Saint Paul, MN 55118 and is currently estimated at $546,714, approximately $239 per square foot. 1021 Sibley Mem Hwy Unit 301 is a home located in Dakota County with nearby schools including Mendota Elementary School, Friendly Hills Middle School, and Two Rivers High School.
Ownership History
Date
Name
Owned For
Owner Type
Purchase Details
Closed on
Dec 5, 2018
Sold by
Revocabl Capistrant Jacqueline J
Bought by
Capistrant Jacqueline J and Terrance D Capistrant Family Trust
Current Estimated Value
Purchase Details
Closed on
Oct 2, 2014
Sold by
Foote Michael H
Bought by
The Terrance D Capistrant Revocable Trus
Purchase Details
Closed on
Nov 9, 2011
Sold by
Ettinger Stephen N
Bought by
Foote Michael H
Purchase Details
Closed on
Jun 21, 2010
Sold by
Arthur A Goodman Family Limited Partners
Bought by
Ettinger Stephen N
Purchase Details
Closed on
Jul 24, 2003
Sold by
Lois M Thompson Revocable Trust
Bought by
Goodman Arthur N Family Lp
Purchase Details
Closed on
Jul 25, 2001
Sold by
Dorothy Weber Revocable Trust
Bought by
Thompson Lois M and Theodore Thompson E
Create a Home Valuation Report for This Property
The Home Valuation Report is an in-depth analysis detailing your home's value as well as a comparison with similar homes in the area
Home Values in the Area
Average Home Value in this Area
Purchase History
| Date | Buyer | Sale Price | Title Company |
|---|---|---|---|
| Capistrant Jacqueline J | -- | None Available | |
| The Terrance D Capistrant Revocable Trus | $405,000 | Edina Realty Title Inc | |
| Foote Michael H | $380,000 | Burnet Title | |
| Ettinger Stephen N | $400,000 | Dca Title | |
| Goodman Arthur N Family Lp | $510,000 | -- | |
| Thompson Lois M | $400,000 | -- |
Source: Public Records
Tax History Compared to Growth
Tax History
| Year | Tax Paid | Tax Assessment Tax Assessment Total Assessment is a certain percentage of the fair market value that is determined by local assessors to be the total taxable value of land and additions on the property. | Land | Improvement |
|---|---|---|---|---|
| 2024 | $4,394 | $525,500 | $52,600 | $472,900 |
| 2023 | $5,050 | $541,000 | $54,100 | $486,900 |
| 2022 | $4,256 | $640,900 | $64,100 | $576,800 |
| 2021 | $4,278 | $503,800 | $50,400 | $453,400 |
| 2020 | $4,476 | $484,200 | $48,400 | $435,800 |
| 2019 | $4,476 | $486,800 | $48,700 | $438,100 |
| 2018 | $4,102 | $459,200 | $45,900 | $413,300 |
| 2017 | $4,131 | $425,200 | $42,500 | $382,700 |
| 2016 | $4,177 | $405,000 | $40,500 | $364,500 |
| 2015 | $4,180 | $405,000 | $40,500 | $364,500 |
| 2014 | -- | $380,447 | $38,065 | $342,382 |
| 2013 | -- | $309,051 | $30,876 | $278,175 |
Source: Public Records
Map
Nearby Homes
- 1101 Sibley Memorial Hwy Unit 303
- 1101 Sibley Memorial Hwy Unit 406
- 1077 Sibley Memorial Hwy Unit 506
- 1077 Sibley Memorial Hwy Unit 602
- 1680 Lexington Ave S
- 1127 Sibley Memorial Hwy Unit 4
- 1759 Lilac Ln
- 1626 Diane Rd
- XXX Barbara Ct
- 1840 Twin Circle Dr
- 1901 Lexington Ave S
- 2221 Youngman Ave Unit 503
- 2275 Youngman Ave Unit 308W
- 2265 Youngman Ave Unit 207E
- 1925 Walsh Ln
- 1320 Riverside Ln Unit 303
- 1320 Riverside Ln Unit 112
- 1860 Eagle Ridge Dr Unit W303
- 1328 Riverside Ln
- 1330 Wachtler Ave
- 1021 Sibley Mem Hwy Unit 203
- 1021 Sibley Mem Hwy Unit 208
- 1021 Sibley Mem Hwy Unit 208
- 1021 Sibley Mem Hwy Unit 201
- 1021 Sibley Mem Hwy Unit 101
- 1021 Sibley Mem Hwy Unit 101
- 1021 Sibley Mem Hwy Unit 408
- 1021 Sibley Mem Hwy Unit 407
- 1021 Sibley Mem Hwy Unit 406
- 1021 Sibley Mem Hwy Unit 405
- 1021 Sibley Mem Hwy Unit 404
- 1021 Sibley Mem Hwy Unit 403
- 1021 Sibley Mem Hwy Unit 402
- 1021 Sibley Mem Hwy Unit 401
- 1021 Sibley Mem Hwy Unit 308
- 1021 Sibley Mem Hwy Unit 307
- 1021 Sibley Mem Hwy Unit 306
- 1021 Sibley Mem Hwy Unit 305
- 1021 Sibley Mem Hwy Unit 304
- 1021 Sibley Mem Hwy Unit 303