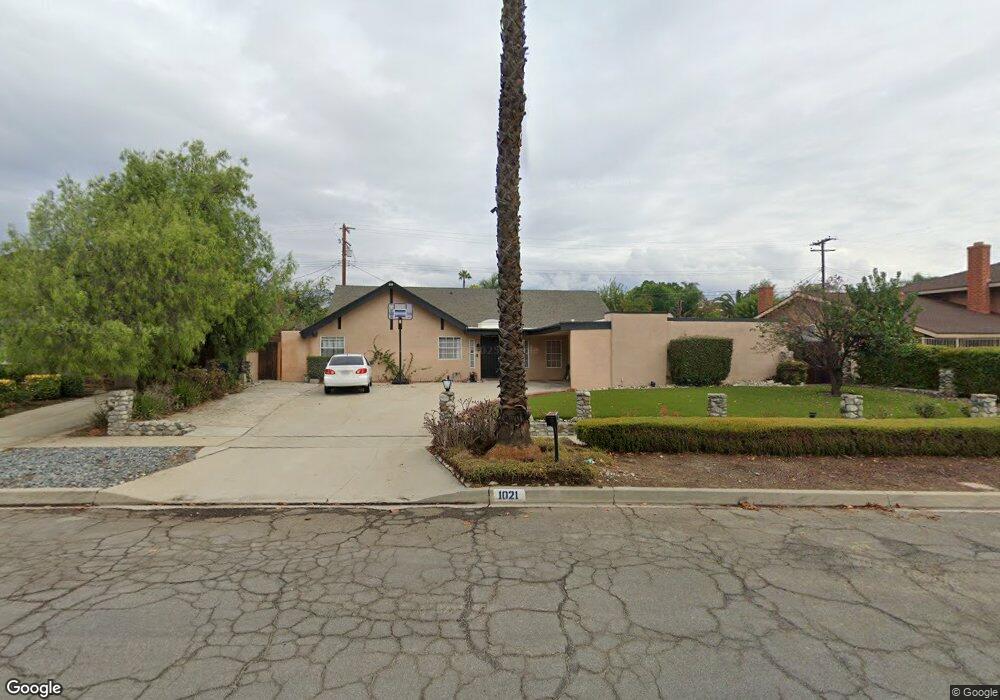
1021 W Notre Dame St Upland, CA 91786
Estimated Value: $964,000 - $1,011,000
4
Beds
3
Baths
2,750
Sq Ft
$358/Sq Ft
Est. Value
About This Home
This home is located at 1021 W Notre Dame St, Upland, CA 91786 and is currently estimated at $985,667, approximately $358 per square foot. 1021 W Notre Dame St is a home located in San Bernardino County with nearby schools including Sycamore Elementary, Pioneer Junior High School, and Upland High School.
Ownership History
Date
Name
Owned For
Owner Type
Purchase Details
Closed on
Jan 24, 2019
Sold by
Swett Seth Timothy
Bought by
Swett Annie P
Current Estimated Value
Home Financials for this Owner
Home Financials are based on the most recent Mortgage that was taken out on this home.
Original Mortgage
$310,000
Outstanding Balance
$278,377
Interest Rate
5.62%
Mortgage Type
Adjustable Rate Mortgage/ARM
Estimated Equity
$707,290
Purchase Details
Closed on
Aug 2, 2018
Sold by
Barron Robert Oscar
Bought by
Swett Annie Pinuela
Purchase Details
Closed on
Dec 2, 1993
Sold by
Great Western Bank Fsb
Bought by
Barron Robert Oscar and Barron Annie P
Home Financials for this Owner
Home Financials are based on the most recent Mortgage that was taken out on this home.
Original Mortgage
$113,000
Interest Rate
7.09%
Create a Home Valuation Report for This Property
The Home Valuation Report is an in-depth analysis detailing your home's value as well as a comparison with similar homes in the area
Home Values in the Area
Average Home Value in this Area
Purchase History
| Date | Buyer | Sale Price | Title Company |
|---|---|---|---|
| Swett Annie P | -- | Wfg National Title Company | |
| Swett Annie Pinuela | -- | None Available | |
| Barron Robert Oscar | $193,000 | Chicago Title Co |
Source: Public Records
Mortgage History
| Date | Status | Borrower | Loan Amount |
|---|---|---|---|
| Open | Swett Annie P | $310,000 | |
| Previous Owner | Barron Robert Oscar | $113,000 |
Source: Public Records
Tax History Compared to Growth
Tax History
| Year | Tax Paid | Tax Assessment Tax Assessment Total Assessment is a certain percentage of the fair market value that is determined by local assessors to be the total taxable value of land and additions on the property. | Land | Improvement |
|---|---|---|---|---|
| 2025 | $3,534 | $328,032 | $107,077 | $220,955 |
| 2024 | $3,534 | $321,600 | $104,977 | $216,623 |
| 2023 | $3,479 | $315,294 | $102,919 | $212,375 |
| 2022 | $3,474 | $309,112 | $100,901 | $208,211 |
| 2021 | $3,395 | $303,051 | $98,923 | $204,128 |
| 2020 | $3,302 | $299,944 | $97,909 | $202,035 |
| 2019 | $3,290 | $294,063 | $95,989 | $198,074 |
| 2018 | $3,285 | $288,297 | $94,107 | $194,190 |
| 2017 | $3,191 | $282,644 | $92,262 | $190,382 |
| 2016 | $3,046 | $277,102 | $90,453 | $186,649 |
| 2015 | $2,926 | $272,939 | $89,094 | $183,845 |
| 2014 | $2,851 | $267,593 | $87,349 | $180,244 |
Source: Public Records
Map
Nearby Homes
- 939 W Pine St Unit 44
- 1018 W 15th St
- 1469 N Erin Ave
- 1427 N San Antonio Ave
- 1193 W 13th St
- 880 W Pine St
- 1090 Springfield St
- 1547 Shamrock Ave
- 1354 Lakewood Ave
- 1359 Lakewood Ave
- 1613 Erin Ave
- 1099 Sullivan St
- 388 Harford Place
- 125 Towns Ave
- 0 Bay St Unit AR25093919
- 1623 N Vallejo Way
- 1669 Erin Ave
- 743 Magnolia Ave
- 1340 Waverly Ct
- 1486 Florence Ct
- 1007 W Notre Dame St
- 1033 W Notre Dame St
- 1018 W 14th St
- 1008 W 14th St
- 1036 W 14th St
- 993 W Notre Dame St
- 1049 W Notre Dame St
- 1370 Oxford Way
- 994 W 14th St
- 1048 W 14th St
- 1044 W Notre Dame St
- 1006 W Notre Dame St
- 981 W Notre Dame St
- 994 W Notre Dame St
- 982 W 14th St
- 1367 Oxford Way
- 1382 Omalley Way
- 1376 Omalley Way
- 1015 W 14th St
- 1396 Omalley Way