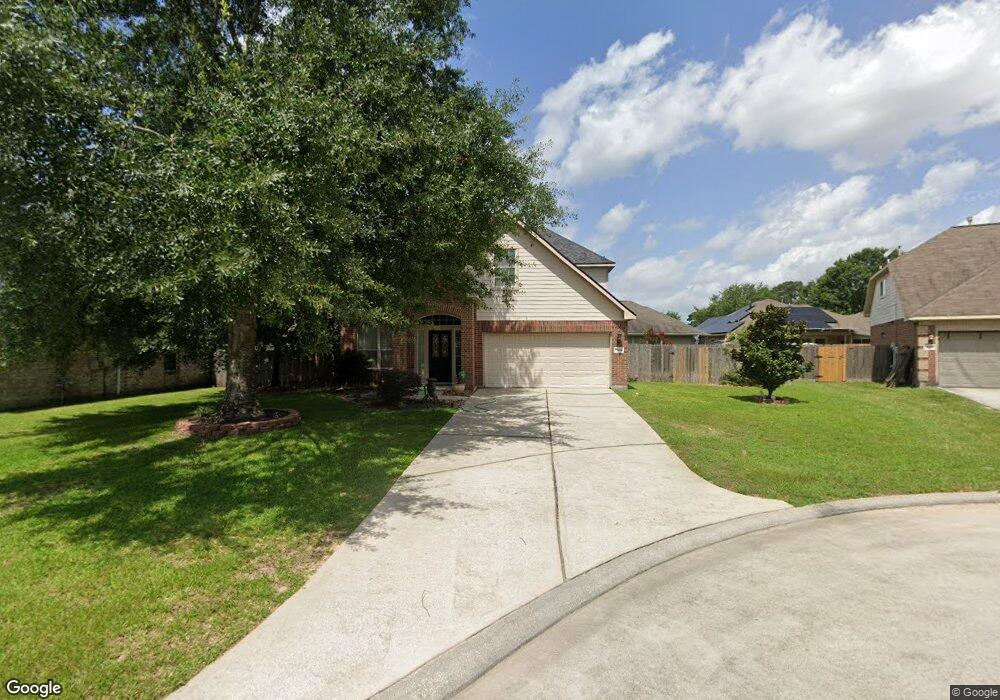
10210 Black Forest Ct Conroe, TX 77385
Estimated Value: $328,288 - $463,000
5
Beds
3
Baths
2,478
Sq Ft
$151/Sq Ft
Est. Value
About This Home
This home is located at 10210 Black Forest Ct, Conroe, TX 77385 and is currently estimated at $374,572, approximately $151 per square foot. 10210 Black Forest Ct is a home located in Montgomery County with nearby schools including Houser Elementary School, Vogel Intermediate School, and Irons J High School.
Ownership History
Date
Name
Owned For
Owner Type
Purchase Details
Closed on
Jun 27, 2013
Sold by
Carter Lora and Garcia Antonio F
Bought by
Allman William A and Allman Jamie S
Current Estimated Value
Home Financials for this Owner
Home Financials are based on the most recent Mortgage that was taken out on this home.
Original Mortgage
$153,900
Outstanding Balance
$110,089
Interest Rate
3.54%
Mortgage Type
New Conventional
Estimated Equity
$264,483
Purchase Details
Closed on
Aug 12, 2009
Sold by
Rm Brothers Development Llc
Bought by
Carter Lora
Home Financials for this Owner
Home Financials are based on the most recent Mortgage that was taken out on this home.
Original Mortgage
$168,393
Interest Rate
5.31%
Mortgage Type
FHA
Purchase Details
Closed on
Dec 21, 2007
Sold by
Borough Park Shopping Center Ltd
Bought by
Allman William A and Allman Jamie S
Create a Home Valuation Report for This Property
The Home Valuation Report is an in-depth analysis detailing your home's value as well as a comparison with similar homes in the area
Home Values in the Area
Average Home Value in this Area
Purchase History
| Date | Buyer | Sale Price | Title Company |
|---|---|---|---|
| Allman William A | -- | None Available | |
| Carter Lora | -- | Vanguard Title | |
| Allman William A | -- | -- |
Source: Public Records
Mortgage History
| Date | Status | Borrower | Loan Amount |
|---|---|---|---|
| Open | Allman William A | $153,900 | |
| Previous Owner | Carter Lora | $168,393 |
Source: Public Records
Tax History Compared to Growth
Tax History
| Year | Tax Paid | Tax Assessment Tax Assessment Total Assessment is a certain percentage of the fair market value that is determined by local assessors to be the total taxable value of land and additions on the property. | Land | Improvement |
|---|---|---|---|---|
| 2025 | $4,056 | $322,408 | $15,764 | $306,644 |
| 2024 | $3,585 | $339,174 | -- | -- |
| 2023 | $3,585 | $308,340 | $15,770 | $320,550 |
| 2022 | $4,864 | $280,310 | $15,770 | $313,390 |
| 2021 | $4,711 | $254,830 | $15,770 | $239,060 |
| 2020 | $4,671 | $240,230 | $15,770 | $224,460 |
| 2019 | $4,522 | $224,490 | $15,770 | $208,720 |
| 2018 | $3,887 | $221,800 | $15,770 | $208,720 |
| 2017 | $4,056 | $201,640 | $15,770 | $185,870 |
| 2016 | $4,269 | $212,230 | $15,770 | $196,460 |
| 2015 | $3,429 | $196,870 | $15,770 | $181,330 |
| 2014 | $3,429 | $178,970 | $15,770 | $163,200 |
Source: Public Records
Map
Nearby Homes
- 10348 Stone Gate Dr
- 1011 Chateau Woods Parkway Dr
- 10200 Tate Ct
- 10208 Jewel Ct
- 10237 Stone Gate Dr
- 10507 Twin Oak Dr
- 711 Pinewood Dr
- 1245 Chateau Woods Parkway Dr
- 10705 Fairview Dr
- 0 Chateau Woods Pkwy Unit 63999227
- 10506 Chateau Ln
- 10732 Twin Oak Dr
- 1410 Glen Oaks Dr
- 1452 Glen Oaks Dr
- 1601 Sweetgum St
- 1428 Flamingo St
- 1424 Flamingo St
- 1420 Flamingo St
- 603 Springwood Dr
- 1512 Glen Oaks Dr
- 10214 Black Forest Ct
- 10206 Black Forest Ct
- 10225 Forest Glade Ct
- 10221 Forest Glade Ct
- 10218 Black Forest Ct
- 10229 Forest Glade Ct
- 10217 Forest Glade Ct
- 10202 Black Forest Ct
- 10233 Forest Glade Ct
- 10213 Forest Glade Ct
- 10211 Black Forest Ct
- 10222 Black Forest Ct
- 10215 Black Forest Ct
- 10203 Black Forest Ct
- 10219 Black Forest Ct
- 10207 Black Forest Ct
- 10237 Forest Glade Ct
- 10209 Forest Glade Ct
- 10223 Black Forest Ct
- 10224 Forest Glade Ct