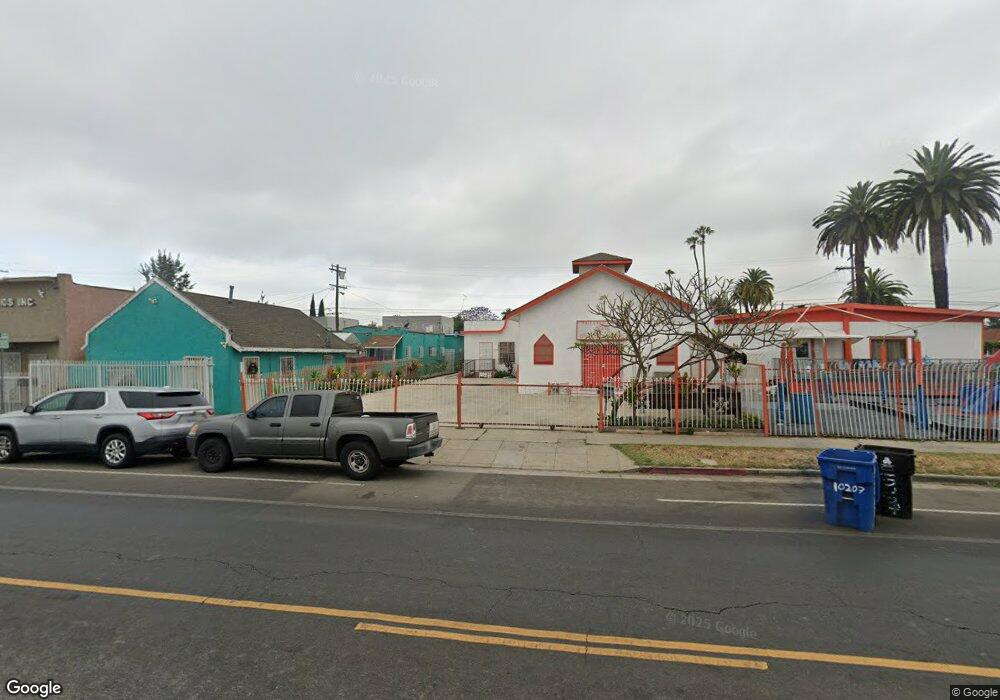
10211 S Main St Los Angeles, CA 90003
Broadway-Manchester NeighborhoodEstimated Value: $404,000 - $544,588
1
Bed
1
Bath
704
Sq Ft
$680/Sq Ft
Est. Value
About This Home
This home is located at 10211 S Main St, Los Angeles, CA 90003 and is currently estimated at $478,397, approximately $679 per square foot. 10211 S Main St is a home located in Los Angeles County with nearby schools including One Hundred Seventh Street Elementary School, Samuel Gompers Middle School, and Alliance College-Ready Middle Academy No. 4.
Ownership History
Date
Name
Owned For
Owner Type
Purchase Details
Closed on
Feb 4, 2019
Sold by
Sisifa Meleane Mafileo
Bought by
Sisifa Tangi K
Current Estimated Value
Purchase Details
Closed on
May 10, 2011
Sold by
Largi Telesia M
Bought by
Vaka Lopeti A
Home Financials for this Owner
Home Financials are based on the most recent Mortgage that was taken out on this home.
Original Mortgage
$393,750
Interest Rate
4.84%
Mortgage Type
Purchase Money Mortgage
Purchase Details
Closed on
Apr 27, 2011
Sold by
Ohara Tim and Ohara Kathleen I
Bought by
Finau Timote Kata and Finau Veisinia
Home Financials for this Owner
Home Financials are based on the most recent Mortgage that was taken out on this home.
Original Mortgage
$393,750
Interest Rate
4.84%
Mortgage Type
Purchase Money Mortgage
Purchase Details
Closed on
Aug 18, 2010
Sold by
Jamison Louis V
Bought by
Ohara Tim and Ohara Kathleen I
Purchase Details
Closed on
May 29, 2003
Sold by
Jamison Mary A
Bought by
Jamison Louis
Create a Home Valuation Report for This Property
The Home Valuation Report is an in-depth analysis detailing your home's value as well as a comparison with similar homes in the area
Home Values in the Area
Average Home Value in this Area
Purchase History
| Date | Buyer | Sale Price | Title Company |
|---|---|---|---|
| Sisifa Tangi K | -- | None Available | |
| Vaka Lopeti A | -- | None Available | |
| Vaka Lopeti A | -- | Advantage Title Inc | |
| Finau Timote Kata | $525,000 | Advantage Title Inc | |
| Ohara Tim | $100,000 | Stewart Title | |
| Jamison Louis | -- | New Century Title Company | |
| Jamison Louis | -- | New Century Title Company |
Source: Public Records
Mortgage History
| Date | Status | Borrower | Loan Amount |
|---|---|---|---|
| Previous Owner | Finau Timote Kata | $393,750 |
Source: Public Records
Tax History Compared to Growth
Tax History
| Year | Tax Paid | Tax Assessment Tax Assessment Total Assessment is a certain percentage of the fair market value that is determined by local assessors to be the total taxable value of land and additions on the property. | Land | Improvement |
|---|---|---|---|---|
| 2025 | $2,902 | $214,970 | $170,109 | $44,861 |
| 2024 | $2,902 | $210,756 | $166,774 | $43,982 |
| 2023 | $2,849 | $206,624 | $163,504 | $43,120 |
| 2022 | $2,726 | $202,574 | $160,299 | $42,275 |
| 2021 | $2,772 | $198,603 | $157,156 | $41,447 |
| 2020 | $2,795 | $196,568 | $155,545 | $41,023 |
| 2019 | $1,584 | $98,192 | $77,522 | $20,670 |
| 2018 | $1,502 | $96,267 | $76,002 | $20,265 |
| 2016 | $1,429 | $92,530 | $73,051 | $19,479 |
| 2015 | $1,407 | $91,141 | $71,954 | $19,187 |
| 2014 | $1,415 | $89,357 | $70,545 | $18,812 |
Source: Public Records
Map
Nearby Homes
- 144 W 101st St
- 154 W 104th St
- 159 E 105th St
- 9900 S Main St
- 220 W 101st St
- 224 W 101st St
- 226 E 105th St
- 231 E Century Blvd
- 10401 San Pedro St
- 10208 S San Pedro St
- 10316 S San Pedro St
- 10016 S San Pedro St
- 330 E 101st St
- 10734 1/4 Main St
- 123 E 108th St
- 337 E Century Blvd
- 323 E 107th St
- 9712 S San Pedro St
- 10712 S Broadway
- 247 E 97th St
- 10213 S Main St
- 114 W 102nd St
- 10219 S Main St
- 120 W 102nd St
- 10219 1022 S Main St
- 10219 10223 S Main St
- 115 W 103rd St Unit 2
- 115 W 103rd St
- 10223 S Main St
- 122 W 102nd St
- 10225 S Main St
- 121 W 103rd St
- 10212 S Main St
- 128 W 102nd St
- 127 W 103rd St
- 113 W 102nd St
- 10210 S Main St Unit 1-4
- 10210 S Main St
- 115 W 102nd St
- 131 W 103rd St