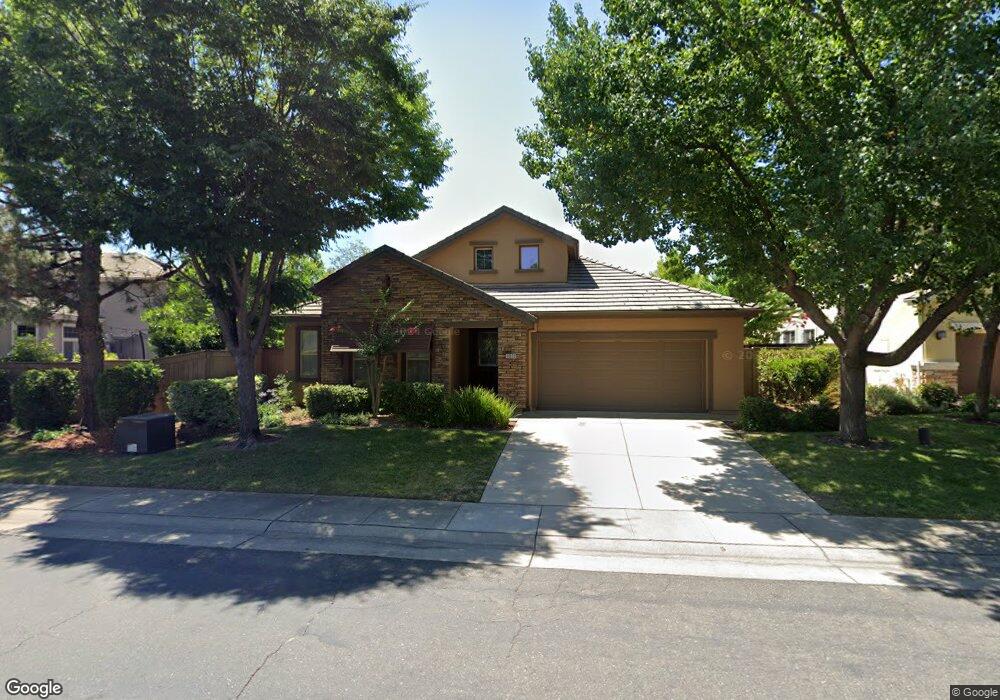
1022 Elsworth Way Folsom, CA 95630
The Parkway NeighborhoodEstimated Value: $835,854 - $911,000
3
Beds
2
Baths
2,507
Sq Ft
$349/Sq Ft
Est. Value
About This Home
This home is located at 1022 Elsworth Way, Folsom, CA 95630 and is currently estimated at $875,714, approximately $349 per square foot. 1022 Elsworth Way is a home located in Sacramento County with nearby schools including Empire Oaks Elementary School, Folsom Middle School, and Vista Del Lago High School.
Ownership History
Date
Name
Owned For
Owner Type
Purchase Details
Closed on
Oct 12, 2022
Sold by
Marouk Sam E and Marouk Zarrin L
Bought by
Sam Marouk And Zarrin Marouk Family Trust
Current Estimated Value
Purchase Details
Closed on
Dec 28, 2017
Sold by
Katz Richard S and Katz Lisa B Jacques
Bought by
Marouk Sam E and Marouk Zarrin L
Home Financials for this Owner
Home Financials are based on the most recent Mortgage that was taken out on this home.
Original Mortgage
$365,000
Interest Rate
3.5%
Mortgage Type
Adjustable Rate Mortgage/ARM
Purchase Details
Closed on
Oct 19, 2012
Sold by
Katz Lisa B Jacques
Bought by
Katz Richard S and Jacques Katz Lisa B
Purchase Details
Closed on
Jan 6, 2004
Sold by
Wl Homes Llc
Bought by
Jacques Lisa B
Home Financials for this Owner
Home Financials are based on the most recent Mortgage that was taken out on this home.
Original Mortgage
$202,000
Interest Rate
5.62%
Mortgage Type
Stand Alone First
Create a Home Valuation Report for This Property
The Home Valuation Report is an in-depth analysis detailing your home's value as well as a comparison with similar homes in the area
Home Values in the Area
Average Home Value in this Area
Purchase History
| Date | Buyer | Sale Price | Title Company |
|---|---|---|---|
| Sam Marouk And Zarrin Marouk Family Trust | -- | -- | |
| Marouk Sam E | $540,000 | Chicago Title Company | |
| Katz Richard S | -- | None Available | |
| Jacques Lisa B | $407,500 | First American Title Co |
Source: Public Records
Mortgage History
| Date | Status | Borrower | Loan Amount |
|---|---|---|---|
| Previous Owner | Marouk Sam E | $365,000 | |
| Previous Owner | Jacques Lisa B | $202,000 |
Source: Public Records
Tax History Compared to Growth
Tax History
| Year | Tax Paid | Tax Assessment Tax Assessment Total Assessment is a certain percentage of the fair market value that is determined by local assessors to be the total taxable value of land and additions on the property. | Land | Improvement |
|---|---|---|---|---|
| 2025 | $7,655 | $614,423 | $193,429 | $420,994 |
| 2024 | $7,655 | $602,377 | $189,637 | $412,740 |
| 2023 | $7,542 | $590,567 | $185,919 | $404,648 |
| 2022 | $7,444 | $578,988 | $182,274 | $396,714 |
| 2021 | $7,356 | $567,636 | $178,700 | $388,936 |
| 2020 | $7,288 | $561,816 | $176,868 | $384,948 |
| 2019 | $7,187 | $550,800 | $173,400 | $377,400 |
| 2018 | $6,704 | $508,637 | $93,710 | $414,927 |
| 2017 | $6,330 | $498,665 | $91,873 | $406,792 |
| 2016 | $6,714 | $488,888 | $90,072 | $398,816 |
| 2015 | $6,511 | $481,546 | $88,720 | $392,826 |
| 2014 | $6,245 | $472,115 | $86,983 | $385,132 |
Source: Public Records
Map
Nearby Homes
- 1046 Smith Way
- 1082 Smith Way
- 1076 Callander Way
- 1173 Fergusen Way
- 1164 Brae Ct
- 1195 Fergusen Way
- 1120 Clydebank Ln
- 193 Westbury Cir
- 1917 Wesley Dr
- 1604 Thurman Way
- 985 Glennfinnan Way
- 1319 Vineyard Ct
- 1522 Thurman Way
- 1376 Folsom Meadows Cir N
- 502 Monet Ln Unit 502
- 1579 Bonanza Ln
- 1553 Bonanza Ln
- 148 Oak Mill Rd
- 778 Heritage Place
- 206 Rivage Cir
- 1028 Elsworth Way
- 1613 Bowen Dr
- 1715 Relvas Ct
- 1617 Bowen Dr
- 1036 Elsworth Way
- 1707 Relvas Ct
- 1609 Bowen Dr
- 1023 Elsworth Way
- 1621 Bowen Dr
- 1027 Elsworth Way
- 1040 Elsworth Way
- 1031 Elsworth Way
- 1605 Bowen Dr
- 1035 Elsworth Way
- 1625 Bowen Dr
- 1044 Elsworth Way
- 1039 Elsworth Way
- 1718 Relvas Ct
- 1601 Bowen Dr
- 1710 Relvas Ct Unit G3