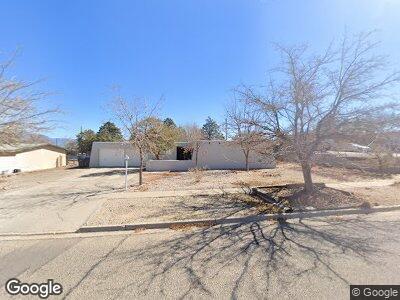
10224 Alder Dr NW Albuquerque, NM 87114
Paradise Hills Civic NeighborhoodEstimated Value: $264,000 - $322,500
3
Beds
3
Baths
1,961
Sq Ft
$154/Sq Ft
Est. Value
About This Home
This home is located at 10224 Alder Dr NW, Albuquerque, NM 87114 and is currently estimated at $301,125, approximately $153 per square foot. 10224 Alder Dr NW is a home located in Bernalillo County with nearby schools including Sierra Vista Elementary School, James Monroe Middle School, and Cibola High School.
Ownership History
Date
Name
Owned For
Owner Type
Purchase Details
Closed on
Aug 27, 2021
Sold by
Tickner Samantha Diane
Bought by
Moody Rachel C and Gutierrez Donaven I
Current Estimated Value
Home Financials for this Owner
Home Financials are based on the most recent Mortgage that was taken out on this home.
Original Mortgage
$124,950
Outstanding Balance
$116,514
Interest Rate
3.25%
Mortgage Type
New Conventional
Estimated Equity
$197,714
Purchase Details
Closed on
Dec 14, 2004
Sold by
Moody Samantha D
Bought by
Moody Matthew N
Home Financials for this Owner
Home Financials are based on the most recent Mortgage that was taken out on this home.
Original Mortgage
$103,000
Interest Rate
5.76%
Mortgage Type
Purchase Money Mortgage
Purchase Details
Closed on
Sep 24, 2002
Sold by
Moody Gregory N and Moody Kristina J
Bought by
Moody Matthew N and Moody Samantha Diane
Purchase Details
Closed on
Apr 10, 2002
Sold by
Oliver Kyle A
Bought by
Provident Bank
Create a Home Valuation Report for This Property
The Home Valuation Report is an in-depth analysis detailing your home's value as well as a comparison with similar homes in the area
Home Values in the Area
Average Home Value in this Area
Purchase History
| Date | Buyer | Sale Price | Title Company |
|---|---|---|---|
| Moody Rachel C | -- | First American Title Ins Co | |
| Moody Matthew N | -- | Fatco | |
| Provident Bank | -- | -- |
Source: Public Records
Mortgage History
| Date | Status | Borrower | Loan Amount |
|---|---|---|---|
| Open | Moody Rachel C | $124,950 | |
| Previous Owner | Moody Matthew | $70,301 | |
| Previous Owner | Moody Matthew N | $103,000 |
Source: Public Records
Tax History Compared to Growth
Tax History
| Year | Tax Paid | Tax Assessment Tax Assessment Total Assessment is a certain percentage of the fair market value that is determined by local assessors to be the total taxable value of land and additions on the property. | Land | Improvement |
|---|---|---|---|---|
| 2024 | $2,032 | $65,467 | $7,999 | $57,468 |
| 2023 | $2,000 | $63,560 | $7,766 | $55,794 |
| 2022 | $1,991 | $63,560 | $7,766 | $55,794 |
| 2021 | $1,278 | $40,989 | $11,345 | $29,644 |
| 2020 | $1,258 | $39,796 | $11,015 | $28,781 |
| 2019 | $1,221 | $38,637 | $10,694 | $27,943 |
| 2018 | $1,177 | $38,637 | $10,694 | $27,943 |
| 2017 | $1,140 | $37,512 | $10,383 | $27,129 |
| 2016 | $1,104 | $35,359 | $9,787 | $25,572 |
| 2015 | $34,330 | $34,330 | $9,502 | $24,828 |
| 2014 | $1,033 | $33,330 | $9,225 | $24,105 |
| 2013 | -- | $32,360 | $8,957 | $23,403 |
Source: Public Records
Map
Nearby Homes
- 5724 Piedra Rd NW
- 10128 Paseo Del Norte NW
- 0 Paseo Del Norte NW Unit 1067391
- 5812 Alegria Rd NW
- 5821 Stratford Ave NW
- 5804 Chaparral Cir NW
- 5917 Avenida La Barranca NW
- 10300 Jarmel Dr NW
- 9936 Bradford Place NW
- 5563 Mansfield Place NW
- 9801 Basha St NW
- 10508 Figaro Dr NW
- 9811 Saragossa St NW
- 9624 Basalt Peak Dr NW
- 9632 Jacks Creek Dr NW
- 9605 Boulder Trail Place NW
- 10233 La Paz Dr NW
- 6104 Bisbee Place NW
- 9631 Iron Rock Dr NW
- 5208 Chapel Dr NW
- 10224 Alder Dr NW
- 10228 Alder Dr NW
- 10220 Alder Dr NW
- 10229 Alder Dr NW
- 10225 Alder Dr NW
- 5640 Camino Canada NW
- 10216 Alder Dr NW
- 5616 Alder Dr NW
- 5636 Camino Canada NW
- 10221 Alder Dr NW
- 10233 Alder Dr NW
- 5644 Camino Canada NW
- 5612 Alder Dr NW
- 10212 Alder Dr NW
- 10217 Alder Dr NW
- 5617 Alder Dr NW
- 5632 Camino Canada NW
- 5701 Alegria Rd NW
- 5736 Piedra Dr NW
- 5736 Piedra Rd NW