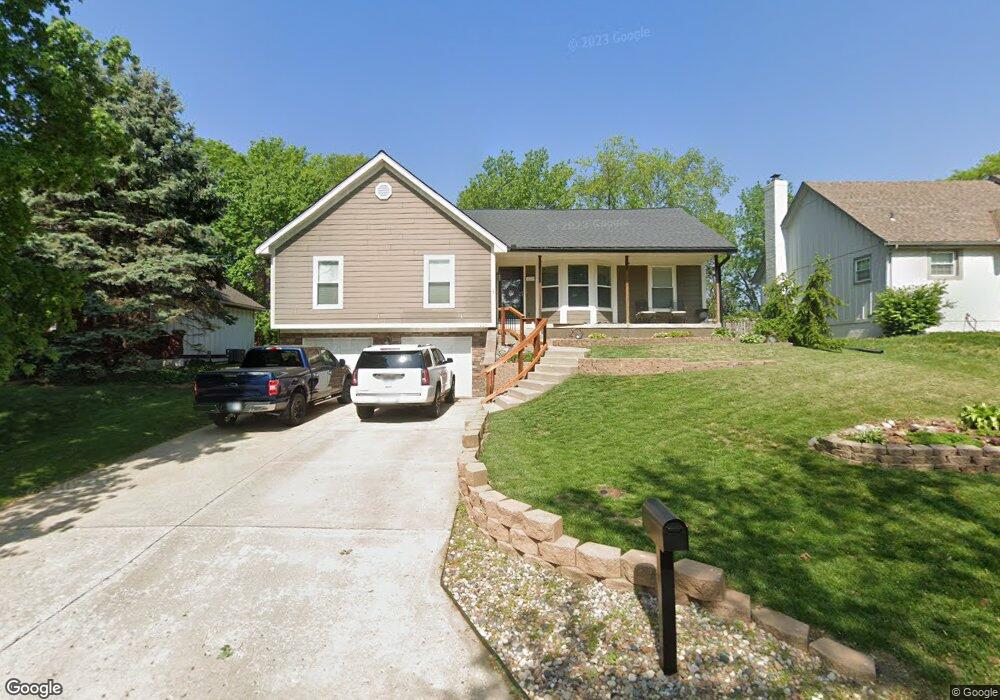
10226 Haskins St Lenexa, KS 66215
Oak Park NeighborhoodEstimated Value: $341,000 - $389,000
3
Beds
3
Baths
1,568
Sq Ft
$234/Sq Ft
Est. Value
About This Home
This home is located at 10226 Haskins St, Lenexa, KS 66215 and is currently estimated at $366,641, approximately $233 per square foot. 10226 Haskins St is a home located in Johnson County with nearby schools including Rosehill Elementary School, Indian Woods Middle School, and Shawnee Mission South High School.
Ownership History
Date
Name
Owned For
Owner Type
Purchase Details
Closed on
Oct 25, 2006
Sold by
Secretary Of Veterans Affairs
Bought by
Boston Jeffery C and Boston Joy K
Current Estimated Value
Home Financials for this Owner
Home Financials are based on the most recent Mortgage that was taken out on this home.
Original Mortgage
$130,000
Outstanding Balance
$77,198
Interest Rate
6.28%
Mortgage Type
New Conventional
Estimated Equity
$289,443
Purchase Details
Closed on
Jun 30, 2005
Sold by
Maricle Shawn J and Doe John
Bought by
The Secretary Of Veterans Affairs
Purchase Details
Closed on
Apr 21, 2003
Sold by
Opperman Kevin A
Bought by
Maricle Shawn J
Home Financials for this Owner
Home Financials are based on the most recent Mortgage that was taken out on this home.
Original Mortgage
$162,690
Interest Rate
5.57%
Mortgage Type
VA
Create a Home Valuation Report for This Property
The Home Valuation Report is an in-depth analysis detailing your home's value as well as a comparison with similar homes in the area
Home Values in the Area
Average Home Value in this Area
Purchase History
| Date | Buyer | Sale Price | Title Company |
|---|---|---|---|
| Boston Jeffery C | -- | All American Title Co | |
| The Secretary Of Veterans Affairs | $141,008 | None Available | |
| Maricle Shawn J | -- | Security Land Title Company |
Source: Public Records
Mortgage History
| Date | Status | Borrower | Loan Amount |
|---|---|---|---|
| Open | Boston Jeffery C | $130,000 | |
| Previous Owner | Maricle Shawn J | $162,690 |
Source: Public Records
Tax History Compared to Growth
Tax History
| Year | Tax Paid | Tax Assessment Tax Assessment Total Assessment is a certain percentage of the fair market value that is determined by local assessors to be the total taxable value of land and additions on the property. | Land | Improvement |
|---|---|---|---|---|
| 2024 | $3,476 | $31,591 | $6,984 | $24,607 |
| 2023 | $3,527 | $31,303 | $6,655 | $24,648 |
| 2022 | $3,286 | $29,130 | $6,049 | $23,081 |
| 2021 | $3,026 | $25,335 | $5,496 | $19,839 |
| 2020 | $2,734 | $22,621 | $4,997 | $17,624 |
| 2019 | $2,623 | $21,678 | $4,168 | $17,510 |
| 2018 | $2,588 | $21,195 | $4,168 | $17,027 |
| 2017 | $2,517 | $19,976 | $3,785 | $16,191 |
| 2016 | $2,350 | $18,388 | $3,481 | $14,907 |
| 2015 | $2,333 | $18,388 | $3,481 | $14,907 |
| 2013 | -- | $16,341 | $3,481 | $12,860 |
Source: Public Records
Map
Nearby Homes
- 13300 W 102nd St
- 10184 Haskins St
- 10211 Hauser St
- 13013 W 101st St
- 10474 Caenen Lake Rd
- 10220 Gillette St
- 10226 Gillette St
- 13401 W 105th Terrace
- 9948 Rosehill Rd
- 10308 Westgate St
- 10331 Westgate St
- 10590 Bradshaw St
- 10580 Long St
- 12808 W 108th St
- 12207 W 101st Terrace
- 10566 Century Ln
- 12400 W 105th Terrace
- 10223 Monrovia St
- 10107 Monrovia St
- 12707 W 108th Terrace
- 10234 Haskins St
- 10218 Haskins St
- 10212 Haskins St
- 10242 Haskins St
- 10231 Haskins St
- 10225 Haskins St
- 10237 Haskins St
- 10217 Haskins St
- 10206 Haskins St
- 10250 Haskins St
- 10245 Haskins St
- 10209 Haskins St
- 10230 Caenen Lake Rd
- 10253 Haskins St
- 10224 Caenen Lake Rd
- 10258 Haskins St
- 10200 Haskins St
- 10246 Caenen Lake Rd
- 10216 Caenen Lake Rd
- 13421 W 102nd St