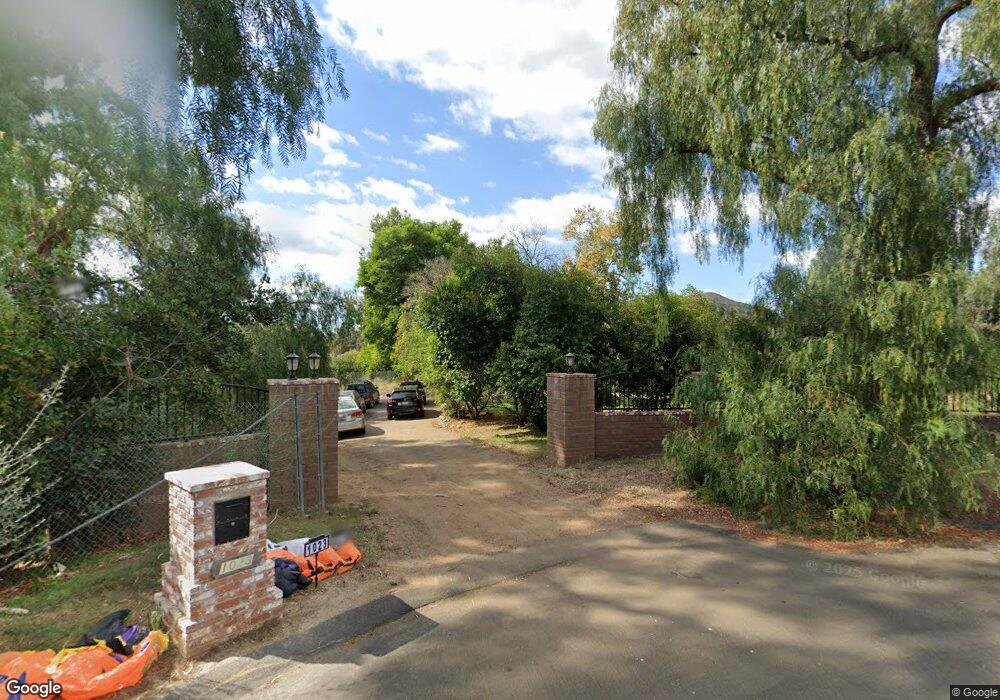
1023 Carmel Dr Simi Valley, CA 93065
West Simi Valley NeighborhoodEstimated Value: $754,941 - $892,000
2
Beds
1
Bath
1,146
Sq Ft
$706/Sq Ft
Est. Value
About This Home
This home is located at 1023 Carmel Dr, Simi Valley, CA 93065 and is currently estimated at $809,485, approximately $706 per square foot. 1023 Carmel Dr is a home located in Ventura County with nearby schools including Madera Elementary School, Sinaloa Middle School, and Royal High School.
Ownership History
Date
Name
Owned For
Owner Type
Purchase Details
Closed on
Dec 1, 2018
Sold by
Bennett Dean L
Bought by
Bennett Dean L and Bennett Victoria C
Current Estimated Value
Purchase Details
Closed on
Jul 2, 2018
Sold by
Bennett Alvin
Bought by
Bennett Alviun and The Alvin Bennett Trust
Create a Home Valuation Report for This Property
The Home Valuation Report is an in-depth analysis detailing your home's value as well as a comparison with similar homes in the area
Home Values in the Area
Average Home Value in this Area
Purchase History
| Date | Buyer | Sale Price | Title Company |
|---|---|---|---|
| Bennett Dean L | -- | None Available | |
| Bennett Dean L | -- | None Available | |
| Bennett Alviun | -- | None Available |
Source: Public Records
Tax History Compared to Growth
Tax History
| Year | Tax Paid | Tax Assessment Tax Assessment Total Assessment is a certain percentage of the fair market value that is determined by local assessors to be the total taxable value of land and additions on the property. | Land | Improvement |
|---|---|---|---|---|
| 2025 | $1,671 | $83,245 | $45,306 | $37,939 |
| 2024 | $1,671 | $81,613 | $44,417 | $37,196 |
| 2023 | $1,568 | $80,013 | $43,546 | $36,467 |
| 2022 | $1,525 | $78,445 | $42,693 | $35,752 |
| 2021 | $1,481 | $76,907 | $41,856 | $35,051 |
| 2020 | $1,428 | $76,121 | $41,428 | $34,693 |
| 2019 | $1,359 | $74,629 | $40,616 | $34,013 |
| 2018 | $1,249 | $73,167 | $39,820 | $33,347 |
| 2017 | $1,203 | $71,734 | $39,040 | $32,694 |
| 2016 | $1,141 | $70,328 | $38,275 | $32,053 |
| 2015 | $1,098 | $69,273 | $37,701 | $31,572 |
| 2014 | $1,060 | $67,917 | $36,963 | $30,954 |
Source: Public Records
Map
Nearby Homes
- 1101 Hacienda Dr
- 252 Capri Dr
- 391 Laguna Terrace
- 75 Vista Lago Dr
- 684 Noble Rd
- 533 Mark Dr
- 459 Mark Dr
- 837 Hillview Cir
- 842 Catlin St
- 1008 N Country Club Dr
- 952 Ettin Ave
- 683 Languid Ln
- 552 Longbranch Rd
- 64 Highland Rd
- 1101 Catlin St Unit A
- 1195 Fitzgerald Rd Unit C
- 1195 Fitzgerald Rd Unit G
- 1165 Fitzgerald Rd Unit G
- 1039 Carmel Dr
- 1064 Hacienda Dr
- 1057 Carmel Dr
- 1026 Carmel Dr
- 1012 Carmel Dr
- 1060 Hacienda Dr
- 1040 Carmel Dr
- 1079 Carmel Dr
- 1060 Carmel Dr
- 389 Laguna Way
- 1025 Cadiz Dr
- 1070 Hacienda Dr
- 1052 Hacienda Dr Unit A
- 1052 Hacienda Dr
- 1082 Hacienda Dr
- 1080 Carmel Dr
- 1091 Carmel Dr
- 1015 Cadiz Dr
- 1039 Cadiz Dr
- 374 Laguna Way