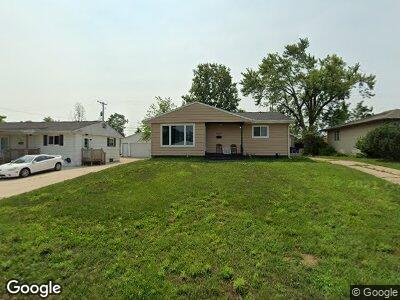
1023 Clifton St NE Cedar Rapids, IA 52402
Noelridge Park NeighborhoodEstimated Value: $154,000 - $173,000
--
Bed
--
Bath
920
Sq Ft
$180/Sq Ft
Est. Value
About This Home
This home is located at 1023 Clifton St NE, Cedar Rapids, IA 52402 and is currently estimated at $165,809, approximately $180 per square foot. 1023 Clifton St NE is a home located in Linn County with nearby schools including Wright Elementary School, Harding Middle School, and George Washington High School.
Ownership History
Date
Name
Owned For
Owner Type
Purchase Details
Closed on
Oct 13, 2016
Sold by
Norton Jessica E and Samuelson Jessica E
Bought by
Mcferren David
Current Estimated Value
Home Financials for this Owner
Home Financials are based on the most recent Mortgage that was taken out on this home.
Original Mortgage
$15,750
Outstanding Balance
$12,795
Interest Rate
3.46%
Purchase Details
Closed on
Nov 25, 2008
Sold by
Samuelson Adam L
Bought by
Norton Jessica E
Purchase Details
Closed on
Mar 23, 2007
Sold by
Lorenz Larry R and Lorenz Constance M
Bought by
Norton Jessica E and Samuelson Adam L
Home Financials for this Owner
Home Financials are based on the most recent Mortgage that was taken out on this home.
Original Mortgage
$117,325
Interest Rate
6.27%
Mortgage Type
Purchase Money Mortgage
Purchase Details
Closed on
Dec 2, 2005
Sold by
Trimble Forrest J
Bought by
Lorenz Larry R and Lorenz Constance M
Home Financials for this Owner
Home Financials are based on the most recent Mortgage that was taken out on this home.
Original Mortgage
$85,000
Interest Rate
6.36%
Mortgage Type
Unknown
Create a Home Valuation Report for This Property
The Home Valuation Report is an in-depth analysis detailing your home's value as well as a comparison with similar homes in the area
Home Values in the Area
Average Home Value in this Area
Purchase History
| Date | Buyer | Sale Price | Title Company |
|---|---|---|---|
| Mcferren David | -- | -- | |
| Norton Jessica E | -- | None Available | |
| Norton Jessica E | $123,000 | None Available | |
| Lorenz Larry R | $74,500 | -- |
Source: Public Records
Mortgage History
| Date | Status | Borrower | Loan Amount |
|---|---|---|---|
| Open | Mcferren David | $15,750 | |
| Open | Mcferren David | $89,250 | |
| Previous Owner | Norton Jessica E | $115,000 | |
| Previous Owner | Norton Jessica E | $117,325 | |
| Previous Owner | Lorenz Larry R | $85,000 |
Source: Public Records
Tax History Compared to Growth
Tax History
| Year | Tax Paid | Tax Assessment Tax Assessment Total Assessment is a certain percentage of the fair market value that is determined by local assessors to be the total taxable value of land and additions on the property. | Land | Improvement |
|---|---|---|---|---|
| 2023 | $2,650 | $144,600 | $27,600 | $117,000 |
| 2022 | $2,492 | $125,600 | $27,600 | $98,000 |
| 2021 | $2,584 | $120,300 | $23,300 | $97,000 |
| 2020 | $2,584 | $117,100 | $23,300 | $93,800 |
| 2019 | $2,328 | $108,000 | $23,300 | $84,700 |
| 2018 | $2,264 | $108,000 | $23,300 | $84,700 |
| 2017 | $2,124 | $99,900 | $23,300 | $76,600 |
| 2016 | $2,124 | $99,900 | $23,300 | $76,600 |
| 2015 | $2,265 | $106,429 | $34,920 | $71,509 |
| 2014 | $2,080 | $106,429 | $34,920 | $71,509 |
| 2013 | $2,030 | $106,429 | $34,920 | $71,509 |
Source: Public Records
Map
Nearby Homes
- 1105 Clifton St NE
- 1106 Regent St NE
- 4417 Loraine St NE
- 4320 Golf St NE
- 4429 Lee St NE
- 143 40th St NE
- 441 42nd St NE
- 3815 Oakland Rd NE
- 513 NE 41st St NE
- 514 40th St NE
- 3841 Lennox Ave NE
- 0 C Ave NE
- 921 36th St NE
- 739 36th St NE
- 638 36th St NE
- 3734 C Ave NE
- 701 36th St NE
- 4508 Ozark St NE
- 1626 Texas Ave NE
- 723 34th St NE
- 1023 Clifton St NE
- 1017 Clifton St NE
- 1027 Clifton St NE
- 1011 Clifton St NE
- 1033 Clifton St NE
- 1007 Clifton St NE
- 1030 Clifton St NE
- 1024 Clifton St NE
- 1018 Clifton St NE
- 1012 Clifton St NE
- 1039 Clifton St NE
- 1030 Old Marion Rd NE
- 1036 Clifton St NE
- 1006 Clifton St NE
- 929 Regent St NE
- 923 Regent St NE
- 1002 Dover St NE
- 917 Regent St NE
- 1041 Clifton St NE
- 1040 Clifton St NE