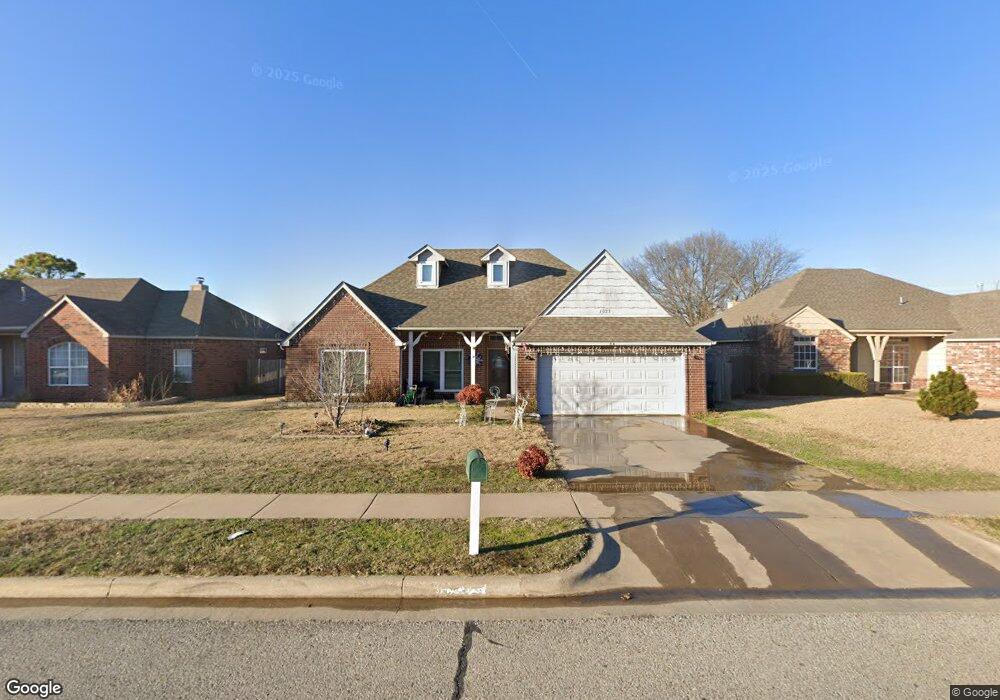
1023 E 146th St Glenpool, OK 74033
Estimated Value: $272,288 - $304,000
3
Beds
2
Baths
1,895
Sq Ft
$151/Sq Ft
Est. Value
About This Home
This home is located at 1023 E 146th St, Glenpool, OK 74033 and is currently estimated at $285,822, approximately $150 per square foot. 1023 E 146th St is a home located in Tulsa County with nearby schools including Glenpool Elementary School, Glenpool Middle School, and Glenpool High School.
Ownership History
Date
Name
Owned For
Owner Type
Purchase Details
Closed on
May 26, 2011
Sold by
Aurora Loan Services Llc
Bought by
Percell Marvin Caleb and Forester Stephanie Denise
Current Estimated Value
Home Financials for this Owner
Home Financials are based on the most recent Mortgage that was taken out on this home.
Original Mortgage
$109,500
Outstanding Balance
$74,918
Interest Rate
4.7%
Mortgage Type
New Conventional
Estimated Equity
$210,904
Purchase Details
Closed on
Mar 21, 2011
Sold by
Pollard Bryon and Pollard Lauri
Bought by
Aurora Loan Services Llc
Purchase Details
Closed on
Oct 20, 2004
Sold by
Southbrooke Homes Inc
Bought by
Pollard Bryon and Pollard Lauri
Purchase Details
Closed on
Nov 20, 2002
Sold by
Glen Village Llc
Bought by
Southbrooke Homes Inc
Home Financials for this Owner
Home Financials are based on the most recent Mortgage that was taken out on this home.
Original Mortgage
$105,400
Interest Rate
5.89%
Mortgage Type
Construction
Create a Home Valuation Report for This Property
The Home Valuation Report is an in-depth analysis detailing your home's value as well as a comparison with similar homes in the area
Home Values in the Area
Average Home Value in this Area
Purchase History
| Date | Buyer | Sale Price | Title Company |
|---|---|---|---|
| Percell Marvin Caleb | $137,000 | Oklahoma Reo Closing & Title | |
| Aurora Loan Services Llc | -- | None Available | |
| Pollard Bryon | $146,000 | -- | |
| Southbrooke Homes Inc | $25,500 | -- |
Source: Public Records
Mortgage History
| Date | Status | Borrower | Loan Amount |
|---|---|---|---|
| Open | Percell Marvin Caleb | $109,500 | |
| Previous Owner | Southbrooke Homes Inc | $105,400 |
Source: Public Records
Tax History
| Year | Tax Paid | Tax Assessment Tax Assessment Total Assessment is a certain percentage of the fair market value that is determined by local assessors to be the total taxable value of land and additions on the property. | Land | Improvement |
|---|---|---|---|---|
| 2025 | $2,677 | $22,329 | $2,240 | $20,089 |
| 2024 | $2,371 | $21,266 | $2,321 | $18,945 |
| 2023 | $2,371 | $20,253 | $2,326 | $17,927 |
| 2022 | $2,223 | $19,288 | $2,737 | $16,551 |
| 2021 | $2,150 | $18,370 | $2,607 | $15,763 |
| 2020 | $2,166 | $18,370 | $2,607 | $15,763 |
| 2019 | $2,181 | $18,370 | $2,607 | $15,763 |
| 2018 | $2,171 | $18,370 | $2,607 | $15,763 |
| 2017 | $2,124 | $18,370 | $2,607 | $15,763 |
| 2016 | $2,146 | $18,370 | $2,607 | $15,763 |
| 2015 | $1,866 | $16,060 | $2,607 | $13,453 |
| 2014 | $1,875 | $16,060 | $2,607 | $13,453 |
Source: Public Records
Map
Nearby Homes
- 1122 E 144th Place
- 688 E 148th Place S
- 14504 S Oak St
- 14468 S Poplar St
- 243 E 141st St
- 1417 E 145th St S
- 849 E 148th Place S
- 687 E 142nd Place
- 394 E 147th St S
- 663 E 148th Place S
- 668 E 148th Place S
- 711 E 149th St S
- 14910 S Sequoia St
- 667 E 149th St S
- 754 E 149th St S
- 14920 S Sequoia St
- 690 E 149th St S
- 712 E 149th St S
- 670 E 149th St S
- 650 E 149th St S
- 1023 E 146th St S
- 1019 E 146th St S
- 1019 E 146th St
- 1027 E 146th St
- 1027 E 146th St S
- 1015 E 146th St S
- 1015 E 146th St
- 1068 E 145th Place
- 1031 E 146th St
- 1100 E 145th Place
- 1044 E 145th Place
- 1106 E 145th Place
- 1101 E 146th St
- 1024 E 146th St
- 1030 E 145th Place
- 1020 E 146th St
- 1024 E 146th St S
- 1028 E 146th St
- 1014 E 146th St
- 1014 E 146th St S
Your Personal Tour Guide
Ask me questions while you tour the home.