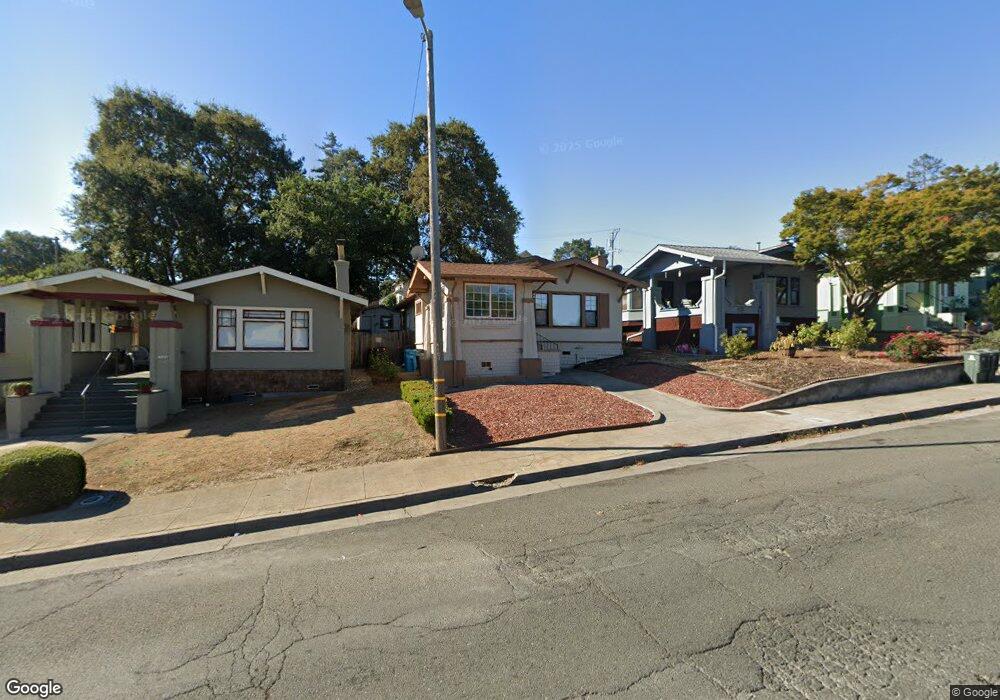
1023 Florida St Vallejo, CA 94590
West Vallejo NeighborhoodEstimated Value: $290,000 - $445,925
2
Beds
1
Bath
961
Sq Ft
$399/Sq Ft
Est. Value
About This Home
This home is located at 1023 Florida St, Vallejo, CA 94590 and is currently estimated at $382,981, approximately $398 per square foot. 1023 Florida St is a home located in Solano County with nearby schools including Highland Elementary, Vallejo High School, and Caliber: ChangeMakers Academy.
Ownership History
Date
Name
Owned For
Owner Type
Purchase Details
Closed on
Dec 8, 2005
Sold by
Mccown Lawrence E and Mccown Ramona Gail
Bought by
Bolanos Jose O and Bolanos Ana L
Current Estimated Value
Home Financials for this Owner
Home Financials are based on the most recent Mortgage that was taken out on this home.
Original Mortgage
$258,000
Outstanding Balance
$158,958
Interest Rate
8.05%
Mortgage Type
Purchase Money Mortgage
Estimated Equity
$224,023
Create a Home Valuation Report for This Property
The Home Valuation Report is an in-depth analysis detailing your home's value as well as a comparison with similar homes in the area
Home Values in the Area
Average Home Value in this Area
Purchase History
| Date | Buyer | Sale Price | Title Company |
|---|---|---|---|
| Bolanos Jose O | $322,500 | Placer Title Co |
Source: Public Records
Mortgage History
| Date | Status | Borrower | Loan Amount |
|---|---|---|---|
| Open | Bolanos Jose O | $258,000 |
Source: Public Records
Tax History Compared to Growth
Tax History
| Year | Tax Paid | Tax Assessment Tax Assessment Total Assessment is a certain percentage of the fair market value that is determined by local assessors to be the total taxable value of land and additions on the property. | Land | Improvement |
|---|---|---|---|---|
| 2025 | $6,470 | $440,714 | $136,652 | $304,062 |
| 2024 | $6,470 | $432,073 | $133,973 | $298,100 |
| 2023 | $5,707 | $423,602 | $131,347 | $292,255 |
| 2022 | $5,625 | $415,297 | $128,772 | $286,525 |
| 2021 | $5,009 | $364,000 | $91,000 | $273,000 |
| 2020 | $4,993 | $356,000 | $92,000 | $264,000 |
| 2019 | $4,933 | $356,000 | $92,000 | $264,000 |
| 2018 | $4,637 | $350,000 | $94,000 | $256,000 |
| 2017 | $3,549 | $263,000 | $73,000 | $190,000 |
| 2016 | $2,800 | $242,000 | $70,000 | $172,000 |
| 2015 | $2,190 | $188,000 | $56,000 | $132,000 |
| 2014 | $1,789 | $152,000 | $46,000 | $106,000 |
Source: Public Records
Map
Nearby Homes