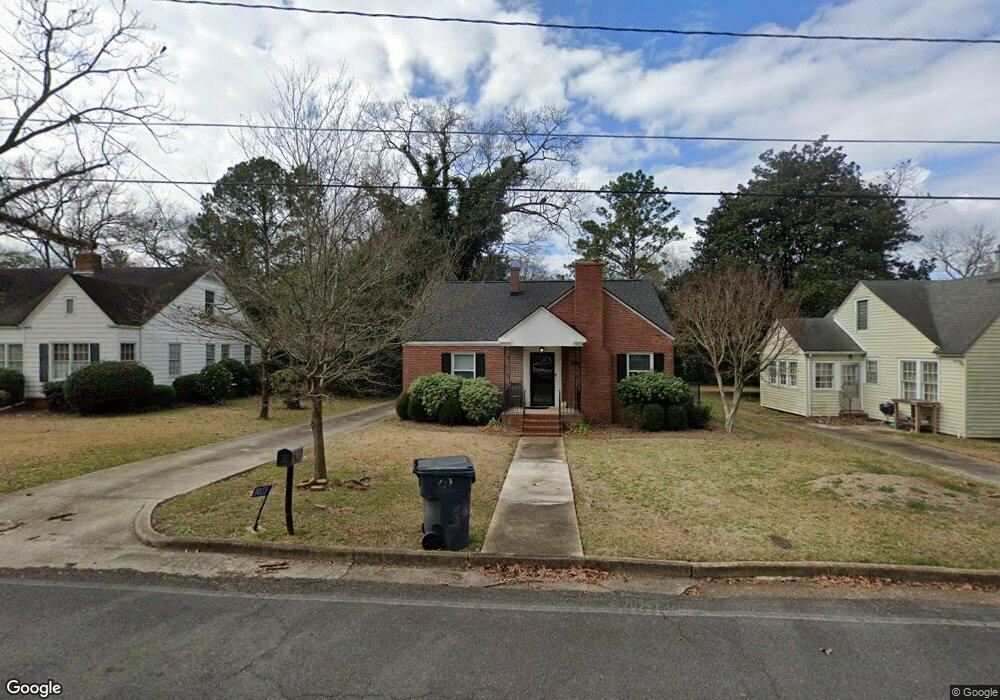
1023 Hancock Dr Americus, GA 31709
Estimated Value: $122,851 - $151,000
2
Beds
2
Baths
1,184
Sq Ft
$113/Sq Ft
Est. Value
About This Home
This home is located at 1023 Hancock Dr, Americus, GA 31709 and is currently estimated at $133,463, approximately $112 per square foot. 1023 Hancock Dr is a home located in Sumter County with nearby schools including Sumter County Primary School, Sumter County Elementary School, and Sumter County Middle School.
Ownership History
Date
Name
Owned For
Owner Type
Purchase Details
Closed on
Mar 9, 2020
Sold by
Morgan Matthew F
Bought by
Johnson Lee Jay and Johnson Cathlene
Current Estimated Value
Purchase Details
Closed on
Dec 15, 2005
Sold by
Jones Nancy H
Bought by
Morgan Matthew F
Home Financials for this Owner
Home Financials are based on the most recent Mortgage that was taken out on this home.
Original Mortgage
$70,000
Interest Rate
6.28%
Mortgage Type
New Conventional
Purchase Details
Closed on
Mar 6, 2000
Sold by
Merritt Mary F
Bought by
Jones Nancy H
Purchase Details
Closed on
Jun 24, 1994
Bought by
Merritt Mary F
Purchase Details
Closed on
Nov 13, 1990
Bought by
Watson Irene
Purchase Details
Closed on
Apr 1, 1989
Bought by
Gatewood Ton H
Purchase Details
Closed on
Jan 1, 1980
Bought by
Johnson Claude E
Create a Home Valuation Report for This Property
The Home Valuation Report is an in-depth analysis detailing your home's value as well as a comparison with similar homes in the area
Home Values in the Area
Average Home Value in this Area
Purchase History
| Date | Buyer | Sale Price | Title Company |
|---|---|---|---|
| Johnson Lee Jay | $63,500 | -- | |
| Morgan Matthew F | $87,500 | -- | |
| Jones Nancy H | $50,000 | -- | |
| Merritt Mary F | $50,000 | -- | |
| Watson Irene | $41,000 | -- | |
| Gatewood Ton H | -- | -- | |
| Johnson Claude E | -- | -- |
Source: Public Records
Mortgage History
| Date | Status | Borrower | Loan Amount |
|---|---|---|---|
| Previous Owner | Morgan Matthew F | $70,000 |
Source: Public Records
Tax History Compared to Growth
Tax History
| Year | Tax Paid | Tax Assessment Tax Assessment Total Assessment is a certain percentage of the fair market value that is determined by local assessors to be the total taxable value of land and additions on the property. | Land | Improvement |
|---|---|---|---|---|
| 2024 | $1,324 | $29,360 | $2,360 | $27,000 |
| 2023 | $1,295 | $29,360 | $2,360 | $27,000 |
| 2022 | $887 | $29,360 | $2,360 | $27,000 |
| 2021 | $1,122 | $29,360 | $2,360 | $27,000 |
| 2020 | $1,266 | $29,360 | $2,360 | $27,000 |
| 2019 | $1,342 | $29,360 | $2,360 | $27,000 |
| 2018 | $860 | $29,360 | $2,360 | $27,000 |
| 2017 | $860 | $29,360 | $2,360 | $27,000 |
| 2016 | $1,234 | $29,360 | $2,360 | $27,000 |
| 2015 | $918 | $32,000 | $2,360 | $29,640 |
| 2014 | $920 | $32,000 | $2,360 | $29,640 |
| 2013 | -- | $32,000 | $2,360 | $29,640 |
Source: Public Records
Map
Nearby Homes
- 1021 Hancock Dr
- 1103 Hancock Dr
- 1019 Hancock Dr
- 1105 Hancock Dr
- 1006 Turner St
- 1108 Turner St
- 1017 Hancock Dr
- 1004 Turner St
- 1022 Hancock Dr
- 1110 Turner St
- 1102 Hancock Dr
- 1002 Turner St
- 1107 Hancock Dr
- 1020 Hancock Dr
- 1015 Hancock Dr
- 1106 Hancock Dr
- 202 Virginia Ave
- 1004 Hancock Dr
- 1108 Hancock Dr
- 1002 Hancock Dr