Estimated Value: $182,643
--
Bed
1
Bath
1,450
Sq Ft
$126/Sq Ft
Est. Value
About This Home
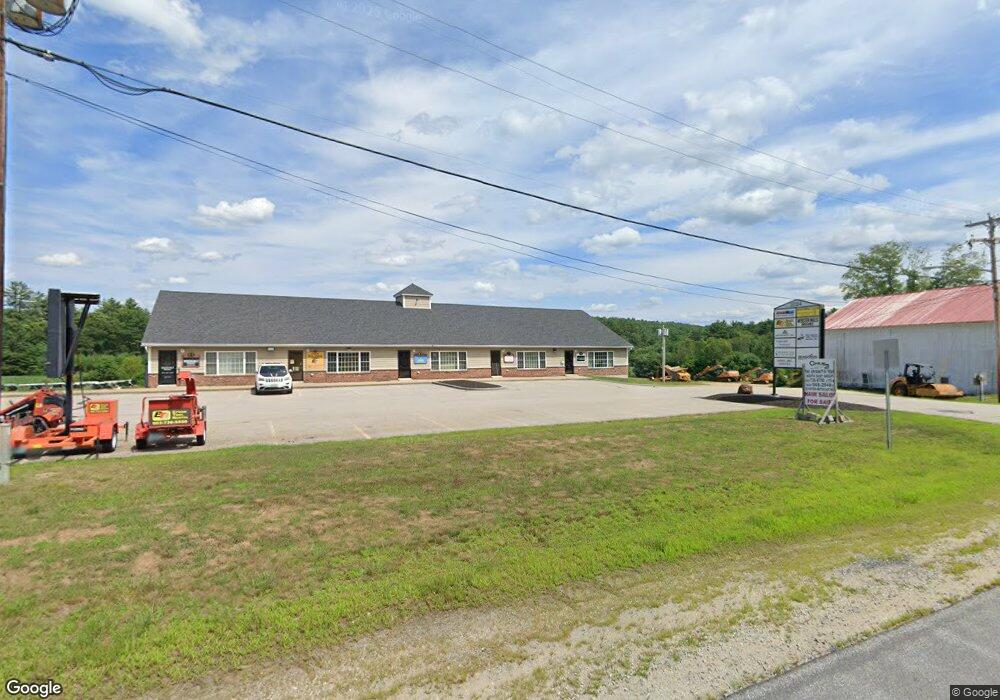
This home is located at 1024 Suncook Valley Hwy Unit D-3, Epsom, NH 03234 and is currently estimated at $182,643, approximately $125 per square foot. 1024 Suncook Valley Hwy Unit D-3 is a home located in Merrimack County with nearby schools including Epsom Central School, Cornerstone Christian Academy, and Epsom Better Buddies.
Ownership History
Date
Name
Owned For
Owner Type
Purchase Details
Closed on
Sep 5, 2019
Sold by
A W Towne Rt
Bought by
Carrigg Commercial Bldrs
Current Estimated Value
Home Financials for this Owner
Home Financials are based on the most recent Mortgage that was taken out on this home.
Original Mortgage
$71,400
Outstanding Balance
$62,669
Interest Rate
3.7%
Mortgage Type
Purchase Money Mortgage
Estimated Equity
$119,974
Purchase Details
Closed on
May 19, 2016
Sold by
Decoff Real Estate Llc
Bought by
Aw Towne Rt
Home Financials for this Owner
Home Financials are based on the most recent Mortgage that was taken out on this home.
Original Mortgage
$72,000
Interest Rate
3.59%
Mortgage Type
Commercial
Purchase Details
Closed on
Dec 11, 2008
Sold by
Cobblestone Properties
Bought by
Decoff Re Llc
Home Financials for this Owner
Home Financials are based on the most recent Mortgage that was taken out on this home.
Original Mortgage
$108,000
Interest Rate
6.49%
Mortgage Type
Commercial
Create a Home Valuation Report for This Property
The Home Valuation Report is an in-depth analysis detailing your home's value as well as a comparison with similar homes in the area
Home Values in the Area
Average Home Value in this Area
Purchase History
| Date | Buyer | Sale Price | Title Company |
|---|---|---|---|
| Carrigg Commercial Bldrs | $102,000 | -- | |
| Aw Towne Rt | $90,000 | -- | |
| Decoff Re Llc | $135,000 | -- |
Source: Public Records
Mortgage History
| Date | Status | Borrower | Loan Amount |
|---|---|---|---|
| Open | Carrigg Commercial Bldrs | $71,400 | |
| Previous Owner | Aw Towne Rt | $72,000 | |
| Previous Owner | Decoff Re Llc | $108,000 |
Source: Public Records
Tax History Compared to Growth
Tax History
| Year | Tax Paid | Tax Assessment Tax Assessment Total Assessment is a certain percentage of the fair market value that is determined by local assessors to be the total taxable value of land and additions on the property. | Land | Improvement |
|---|---|---|---|---|
| 2024 | $2,909 | $109,200 | $0 | $109,200 |
| 2023 | $2,690 | $109,200 | $0 | $109,200 |
| 2022 | $2,603 | $109,200 | $0 | $109,200 |
| 2021 | $2,581 | $109,200 | $0 | $109,200 |
| 2020 | $2,384 | $109,200 | $0 | $109,200 |
| 2019 | $3,264 | $120,500 | $0 | $120,500 |
| 2018 | $3,129 | $120,500 | $0 | $120,500 |
| 2017 | $3,093 | $120,500 | $0 | $120,500 |
| 2016 | $3,016 | $120,500 | $0 | $120,500 |
| 2015 | $2,870 | $120,500 | $0 | $120,500 |
| 2014 | $2,816 | $126,500 | $0 | $126,500 |
| 2013 | -- | $126,500 | $0 | $126,500 |
Source: Public Records
Map
Nearby Homes
- 0 Dover Unit 5027742
- 42 Windymere Dr
- 43 Black Hall Rd Unit A2
- 19 Depot Rd
- 19 Silver Hill Dr
- 15 Canterbury Rd
- 14 Short Falls Rd
- 280 Webster Mills Rd
- 9 Princess Ln
- 20 Mountain Rd
- 116 Webster Mills Rd
- 67 Swiggey Brook Rd
- 132 Chestnut Pond Rd
- 19 Meadow Lark Ln
- 268 Mountain Rd
- 27 Tyler Ave
- 0 Poor Town Rd Unit 4
- 239 Ricker Rd
- 24 John Hardie Way
- 361 Dover Rd
- 1024 Suncook Valley Hwy
- 1024 Suncook Valley Hwy Unit D-3
- 1024 Suncook Valley Hwy Unit D1
- 1024 Suncook Valley Hwy
- 1024 Suncook Valley Hwy
- 1024 Suncook Valley Hwy
- 1024 Suncook Valley Hwy
- 1024 Suncook Valley Hwy Unit D7
- 1024 Suncook Valley Hwy Unit D-7
- 1024 Suncook Valley Hwy
- 1024 Suncook Valley Hwy
- 1024 Suncook Valley Hwy Unit D1
- 1024 Suncook Valley Hwy
- 1024 Suncook Valley Hwy Unit D-1
- 1034 Suncook Valley Hwy
- Lot 82 Gauthier
- 1003 Suncook Valley Hwy
- 1033 Suncook Valley Hwy S
- Lot 82-3 Gauthier Dr
- 82-3 Gauthier Dr