Estimated Value: $1,267,283 - $1,593,000
3
Beds
3
Baths
2,107
Sq Ft
$663/Sq Ft
Est. Value
About This Home
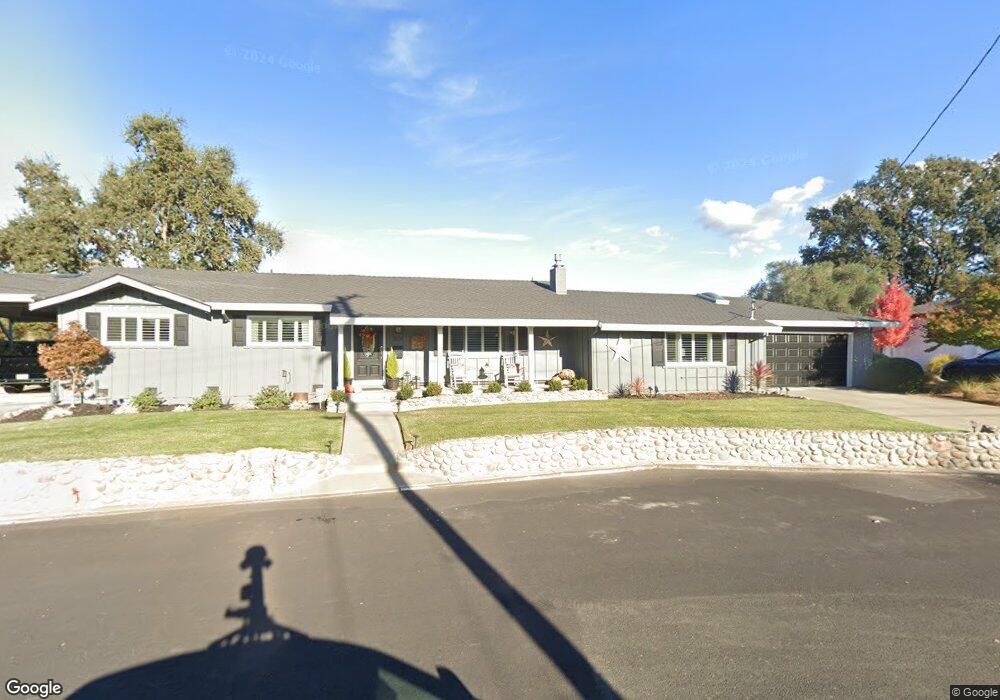
This home is located at 1024 Woodside Dr, Napa, CA 94558 and is currently estimated at $1,396,071, approximately $662 per square foot. 1024 Woodside Dr is a home located in Napa County with nearby schools including Vichy Elementary School, Silverado Middle School, and Faith Learning Center.
Ownership History
Date
Name
Owned For
Owner Type
Purchase Details
Closed on
Oct 10, 2018
Sold by
Bosson David W and Bosson Sharon L
Bought by
Bosson David W and Bosson Sharon L
Current Estimated Value
Purchase Details
Closed on
Feb 4, 2003
Sold by
Bosson David W and Bosson Sharon L
Bought by
Bosson David W and Bosson Sharon L
Home Financials for this Owner
Home Financials are based on the most recent Mortgage that was taken out on this home.
Original Mortgage
$225,000
Interest Rate
5.83%
Purchase Details
Closed on
Jan 16, 2002
Sold by
Bosson David W and Bosson Sharon L
Bought by
Bosson David W and Bosson Sharon L
Home Financials for this Owner
Home Financials are based on the most recent Mortgage that was taken out on this home.
Original Mortgage
$175,000
Interest Rate
7.11%
Purchase Details
Closed on
Sep 21, 1999
Sold by
Bosson David W Um and Bosson M
Bought by
Bosson David W and Bosson Sharon L
Create a Home Valuation Report for This Property
The Home Valuation Report is an in-depth analysis detailing your home's value as well as a comparison with similar homes in the area
Home Values in the Area
Average Home Value in this Area
Purchase History
| Date | Buyer | Sale Price | Title Company |
|---|---|---|---|
| Bosson David W | -- | None Available | |
| Bosson David W | -- | First American Title Co Napa | |
| Bosson David W | -- | First American Title Co Napa | |
| Bosson David W | -- | -- | |
| Bosson David W | -- | First American Title Co | |
| Bosson David W | -- | -- |
Source: Public Records
Mortgage History
| Date | Status | Borrower | Loan Amount |
|---|---|---|---|
| Closed | Bosson David W | $225,000 | |
| Closed | Bosson David W | $175,000 |
Source: Public Records
Tax History Compared to Growth
Tax History
| Year | Tax Paid | Tax Assessment Tax Assessment Total Assessment is a certain percentage of the fair market value that is determined by local assessors to be the total taxable value of land and additions on the property. | Land | Improvement |
|---|---|---|---|---|
| 2025 | $3,953 | $362,622 | $132,312 | $230,310 |
| 2024 | $3,953 | $355,513 | $129,718 | $225,795 |
| 2023 | $3,953 | $348,543 | $127,175 | $221,368 |
| 2022 | $3,824 | $341,710 | $124,682 | $217,028 |
| 2021 | $3,765 | $335,011 | $122,238 | $212,773 |
| 2020 | $3,734 | $331,577 | $120,985 | $210,592 |
| 2019 | $3,664 | $325,076 | $118,613 | $206,463 |
| 2018 | $3,551 | $318,703 | $116,288 | $202,415 |
| 2017 | $3,492 | $312,455 | $114,008 | $198,447 |
| 2016 | $3,452 | $306,329 | $111,773 | $194,556 |
| 2015 | $3,249 | $301,729 | $110,095 | $191,634 |
| 2014 | $3,202 | $295,820 | $107,939 | $187,881 |
Source: Public Records
Map
Nearby Homes
- 1180 Monticello Rd
- 6 Old Coach Rd
- 1079 Hedgeside Ave
- 1776 Monticello Rd
- 1101 Hedgeside Ave
- 2231 1st Ave
- 2297 1st Ave
- 0 Silverado Trail Unit 325079451
- 1777 Mckinley Rd
- 2015 Monticello Rd
- 2748 Elks Way
- 345 Ashlar Dr
- 2420 Shoreline Dr
- 2060 Hagen Rd
- 2761 Elks Way
- 2776 Elks Way
- 2773 Elks Way
- 3000 Hagen Rd
- 2090 Big Ranch Rd
- 2318 Lakepark Dr
- 1026 Woodside Dr
- 1020 Woodside Dr
- 1032 Woodside Dr
- 1023 Woodside Dr
- 1019 Woodside Dr
- 1029 Woodside Dr
- 1038 Woodside Dr
- 1073 Monticello Rd
- 1035 Woodside Dr
- 1002 Woodside Dr
- 1044 Woodside Dr
- 1041 Woodside Dr Unit 547
- 1059 Monticello Rd
- 1050 Woodside Dr
- 1047 Woodside Dr
- 1057 Monticello Rd
- 1055 Monticello Rd
- 1056 Woodside Dr
- 1098 Rose Dr
- 47 Rosemont Cir