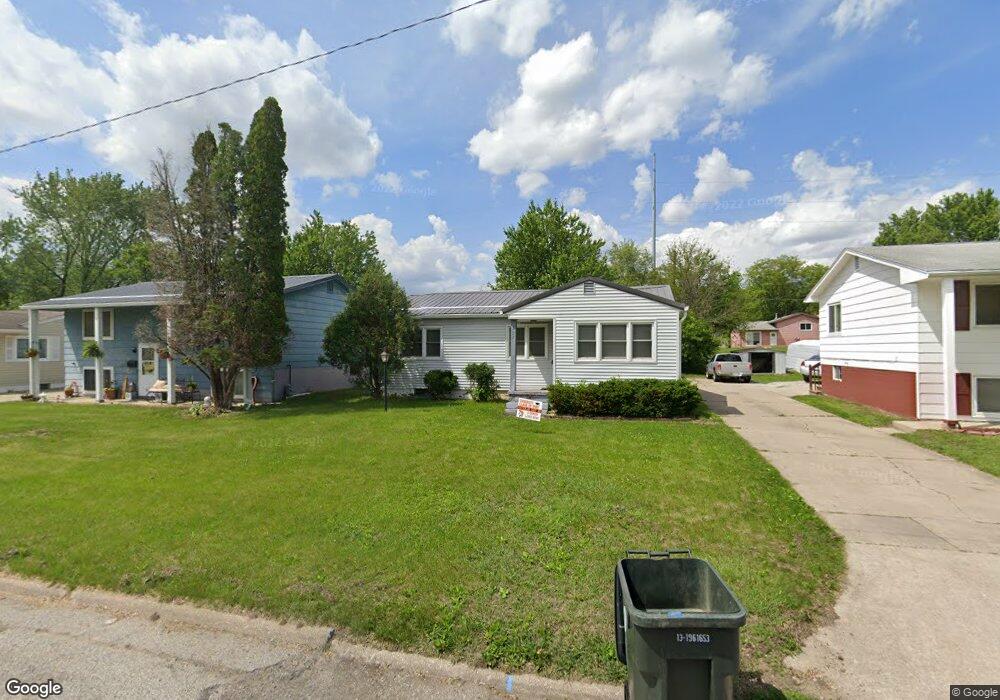
1025 Adams St Waterloo, IA 50703
Unity NeighborhoodEstimated Value: $67,000 - $94,000
3
Beds
1
Bath
864
Sq Ft
$98/Sq Ft
Est. Value
About This Home
This home is located at 1025 Adams St, Waterloo, IA 50703 and is currently estimated at $84,333, approximately $97 per square foot. 1025 Adams St is a home located in Black Hawk County with nearby schools including Cunningham School, George Washington Carver Academy, and West High School.
Ownership History
Date
Name
Owned For
Owner Type
Purchase Details
Closed on
Apr 20, 2023
Sold by
Haugebak Dorothy C
Bought by
Haugebak Robert C
Current Estimated Value
Home Financials for this Owner
Home Financials are based on the most recent Mortgage that was taken out on this home.
Original Mortgage
$512,829
Outstanding Balance
$498,178
Interest Rate
6.65%
Mortgage Type
New Conventional
Estimated Equity
-$413,845
Purchase Details
Closed on
Apr 7, 2023
Sold by
Haugebak Robert C and Haugebak Jean L
Bought by
Crf Rentals Llc
Home Financials for this Owner
Home Financials are based on the most recent Mortgage that was taken out on this home.
Original Mortgage
$512,829
Outstanding Balance
$498,178
Interest Rate
6.65%
Mortgage Type
New Conventional
Estimated Equity
-$413,845
Purchase Details
Closed on
Dec 15, 2022
Sold by
Haugebak Dorothy C
Bought by
Haugebak Robert C
Create a Home Valuation Report for This Property
The Home Valuation Report is an in-depth analysis detailing your home's value as well as a comparison with similar homes in the area
Home Values in the Area
Average Home Value in this Area
Purchase History
| Date | Buyer | Sale Price | Title Company |
|---|---|---|---|
| Haugebak Robert C | -- | None Listed On Document | |
| Crf Rentals Llc | $525,000 | None Listed On Document | |
| Haugebak Robert C | -- | -- |
Source: Public Records
Mortgage History
| Date | Status | Borrower | Loan Amount |
|---|---|---|---|
| Open | Crf Rentals Llc | $512,829 |
Source: Public Records
Tax History Compared to Growth
Tax History
| Year | Tax Paid | Tax Assessment Tax Assessment Total Assessment is a certain percentage of the fair market value that is determined by local assessors to be the total taxable value of land and additions on the property. | Land | Improvement |
|---|---|---|---|---|
| 2025 | $1,226 | $73,010 | $8,080 | $64,930 |
| 2024 | $1,226 | $56,560 | $8,080 | $48,480 |
| 2023 | $1,028 | $56,560 | $8,080 | $48,480 |
| 2022 | $1,028 | $46,780 | $8,080 | $38,700 |
| 2021 | $1,000 | $46,780 | $8,080 | $38,700 |
| 2020 | $1,160 | $52,040 | $6,310 | $45,730 |
| 2019 | $1,160 | $52,040 | $6,310 | $45,730 |
| 2018 | $926 | $41,490 | $6,310 | $35,180 |
| 2017 | $952 | $41,490 | $6,310 | $35,180 |
| 2016 | $942 | $41,490 | $6,310 | $35,180 |
| 2015 | $942 | $41,490 | $6,310 | $35,180 |
| 2014 | $960 | $41,490 | $6,310 | $35,180 |
Source: Public Records
Map
Nearby Homes
- 1002 Mobile St
- 630 Webster St
- 232 Webster St
- Lot 11 & 12 Webster St
- 324 Bates St
- 0 Bates St
- 324 Sumner St
- 218 Sumner St
- 233 Quincy St
- 823 Glenwood St
- 0 Plain View St
- 0 Plainview & Shirley St Unit NBR20254115
- 818 Steely St
- 431 Wendell Ct
- 722 S View Dr
- 1127 Independence Ave
- 337 Almond St
- 607 Logan Ave
- 126 Hope Ave
- 211 Madison St