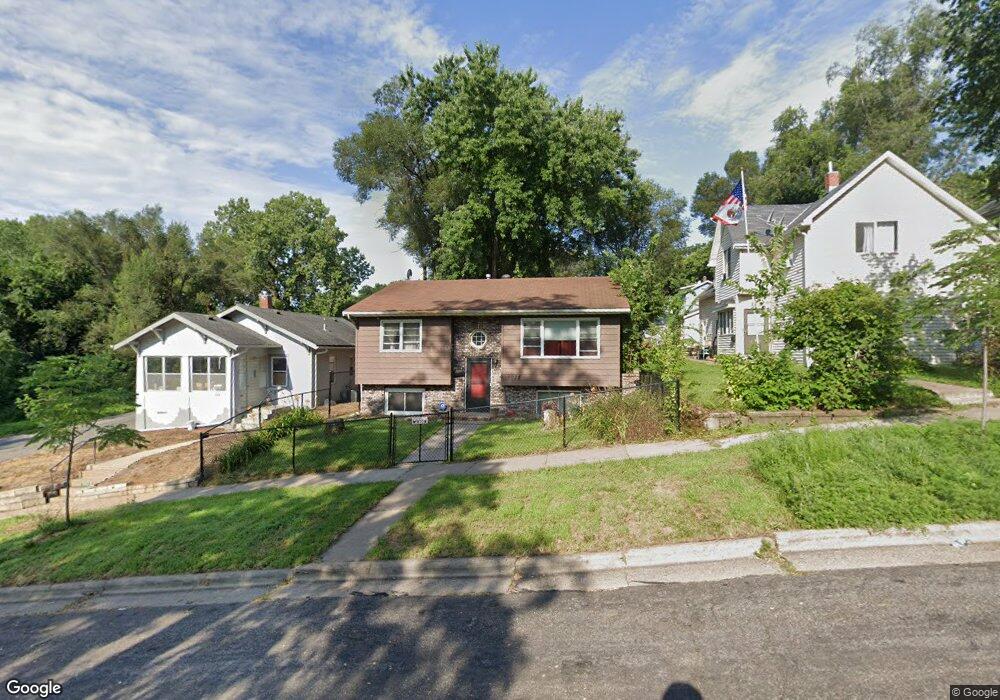
1025 Bradley St Saint Paul, MN 55130
Payne-Phalen NeighborhoodEstimated Value: $251,000 - $300,000
3
Beds
2
Baths
1,288
Sq Ft
$217/Sq Ft
Est. Value
About This Home
This home is located at 1025 Bradley St, Saint Paul, MN 55130 and is currently estimated at $279,941, approximately $217 per square foot. 1025 Bradley St is a home located in Ramsey County with nearby schools including Bruce F Vento Elementary School, Washington Technology Magnet School, and Community Of Peace Academy.
Ownership History
Date
Name
Owned For
Owner Type
Purchase Details
Closed on
Jun 30, 2016
Sold by
Vang Song and Lee Doua
Bought by
Burnett Nikka
Current Estimated Value
Home Financials for this Owner
Home Financials are based on the most recent Mortgage that was taken out on this home.
Original Mortgage
$146,791
Outstanding Balance
$117,485
Interest Rate
3.66%
Mortgage Type
FHA
Estimated Equity
$162,456
Purchase Details
Closed on
Apr 17, 1997
Sold by
Hud
Bought by
Lee Doua and Vang Song
Create a Home Valuation Report for This Property
The Home Valuation Report is an in-depth analysis detailing your home's value as well as a comparison with similar homes in the area
Home Values in the Area
Average Home Value in this Area
Purchase History
| Date | Buyer | Sale Price | Title Company |
|---|---|---|---|
| Burnett Nikka | $149,500 | Titlesmart Inc | |
| Lee Doua | $60,600 | -- |
Source: Public Records
Mortgage History
| Date | Status | Borrower | Loan Amount |
|---|---|---|---|
| Open | Burnett Nikka | $146,791 |
Source: Public Records
Tax History
| Year | Tax Paid | Tax Assessment Tax Assessment Total Assessment is a certain percentage of the fair market value that is determined by local assessors to be the total taxable value of land and additions on the property. | Land | Improvement |
|---|---|---|---|---|
| 2025 | $4,046 | $266,800 | $25,000 | $241,800 |
| 2023 | $4,046 | $247,000 | $20,000 | $227,000 |
| 2022 | $3,304 | $227,100 | $20,000 | $207,100 |
| 2021 | $3,244 | $208,000 | $20,000 | $188,000 |
| 2020 | $2,920 | $191,500 | $9,800 | $181,700 |
| 2019 | $2,366 | $180,500 | $9,800 | $170,700 |
| 2018 | $2,232 | $156,200 | $9,800 | $146,400 |
| 2017 | $1,820 | $146,300 | $9,800 | $136,500 |
| 2016 | $2,256 | $0 | $0 | $0 |
| 2015 | $1,976 | $123,500 | $9,800 | $113,700 |
| 2014 | $2,394 | $0 | $0 | $0 |
Source: Public Records
Map
Nearby Homes
- 1067 Jessie St
- 1039 Edgerton St
- 955 Bradley St
- 955 Burr St
- 1092 Edgerton St
- 1054 Arkwright St
- 620 Cook Ave E
- 1123 Edgerton St
- 601 Sims Ave
- 1158 Bradley St
- 654 Jessamine Ave E
- 1174 Edgerton St
- 880 Clark St
- 680 Lawson Ave E
- 419 Rose Ave E
- 1195 Edgerton St
- 666 Sims Ave
- 673 Jessamine Ave E
- 608 Wells St
- 676 Geranium Ave E
Your Personal Tour Guide
Ask me questions while you tour the home.