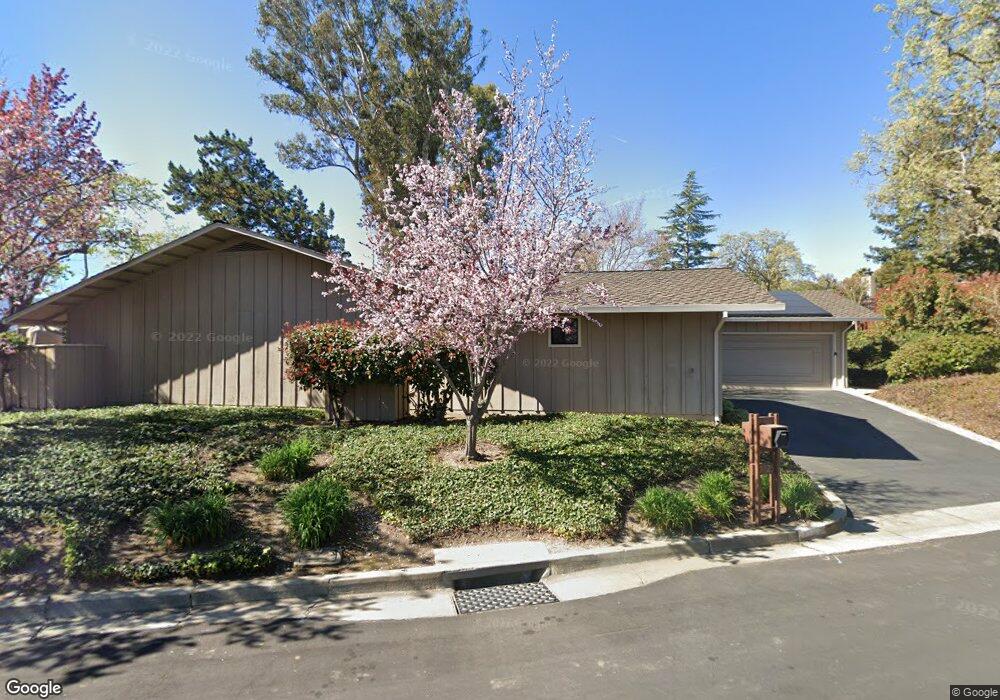
1025 Lassen Dr Menlo Park, CA 94025
Sharon Heights NeighborhoodEstimated Value: $2,849,000 - $4,081,000
2
Beds
3
Baths
2,570
Sq Ft
$1,299/Sq Ft
Est. Value
About This Home
This home is located at 1025 Lassen Dr, Menlo Park, CA 94025 and is currently estimated at $3,338,313, approximately $1,298 per square foot. 1025 Lassen Dr is a home located in San Mateo County with nearby schools including Las Lomitas Elementary School, La Entrada Middle School, and Menlo-Atherton High School.
Ownership History
Date
Name
Owned For
Owner Type
Purchase Details
Closed on
Oct 26, 2009
Sold by
Goldman Milton and Goldman Michele
Bought by
Goldman Milton and Goldman Michele
Current Estimated Value
Home Financials for this Owner
Home Financials are based on the most recent Mortgage that was taken out on this home.
Original Mortgage
$340,000
Outstanding Balance
$223,035
Interest Rate
5.25%
Mortgage Type
New Conventional
Estimated Equity
$3,115,278
Purchase Details
Closed on
Sep 22, 2009
Sold by
Baxter Richard H and Krause Georgia Baxter
Bought by
Goldman Milton and Goldman Michele
Home Financials for this Owner
Home Financials are based on the most recent Mortgage that was taken out on this home.
Original Mortgage
$340,000
Outstanding Balance
$223,035
Interest Rate
5.25%
Mortgage Type
New Conventional
Estimated Equity
$3,115,278
Purchase Details
Closed on
Apr 13, 2004
Sold by
Baxter Nancy R
Bought by
Baxter Nancy R
Purchase Details
Closed on
Jun 30, 1994
Sold by
Morgan Melvin H
Bought by
Baxter Nancy R
Create a Home Valuation Report for This Property
The Home Valuation Report is an in-depth analysis detailing your home's value as well as a comparison with similar homes in the area
Home Values in the Area
Average Home Value in this Area
Purchase History
| Date | Buyer | Sale Price | Title Company |
|---|---|---|---|
| Goldman Milton | -- | None Available | |
| Goldman Milton | $1,225,000 | Chicago Title Company | |
| Baxter Nancy R | -- | -- | |
| Baxter Nancy R | -- | -- |
Source: Public Records
Mortgage History
| Date | Status | Borrower | Loan Amount |
|---|---|---|---|
| Open | Goldman Milton | $340,000 |
Source: Public Records
Tax History
| Year | Tax Paid | Tax Assessment Tax Assessment Total Assessment is a certain percentage of the fair market value that is determined by local assessors to be the total taxable value of land and additions on the property. | Land | Improvement |
|---|---|---|---|---|
| 2025 | $10,529 | $806,236 | $403,118 | $403,118 |
| 2023 | $10,529 | $774,930 | $387,465 | $387,465 |
| 2022 | $10,045 | $759,736 | $379,868 | $379,868 |
| 2021 | $9,889 | $744,840 | $372,420 | $372,420 |
| 2020 | $9,704 | $737,204 | $368,602 | $368,602 |
| 2019 | $9,904 | $722,750 | $361,375 | $361,375 |
| 2018 | $9,445 | $708,580 | $354,290 | $354,290 |
| 2017 | $9,122 | $694,688 | $347,344 | $347,344 |
| 2016 | $9,025 | $681,068 | $340,534 | $340,534 |
| 2015 | $8,832 | $670,838 | $335,419 | $335,419 |
| 2014 | $8,727 | $657,698 | $328,849 | $328,849 |
Source: Public Records
Map
Nearby Homes
- 1110 Trinity Dr
- 927 Continental Dr
- 11 Susan Gale Ct
- 935 Monte Rosa Dr
- 1030 Deanna Dr
- 1100 Sharon Park Dr Unit 3
- 2319 Warner Range Ave
- 830 Monte Rosa Dr
- 184 Sand Hill Cir
- 166 Sand Hill Cir
- 349 Walsh Rd
- 206 Sand Hill Cir
- 2190 Mills Ave
- 300 Sand Hill Cir Unit 301
- 85 Belbrook Way
- 2066 Sterling Ave
- 948 Altschul Ave
- 940 Altschul Ave
- 93 Broadacres Rd
- 2036 Barney Ave
- 1015 Lassen Dr
- 1035 Lassen Dr
- 1010 Lassen Dr
- 1020 Lassen Dr
- 1000 Lassen Dr
- 1035 Whitney Dr
- 1005 Lassen Dr
- 1025 Whitney Dr
- 990 Lassen Dr
- 1030 Lassen Dr
- 1045 Whitney Dr
- 995 Lassen Dr
- 1015 Whitney Dr
- 980 Lassen Dr
- 1040 Lassen Dr
- 985 Lassen Dr
- 1015 Continental Dr
- 3 Whitney Ct
- 970 Lassen Dr
- 1055 Whitney Dr
Your Personal Tour Guide
Ask me questions while you tour the home.