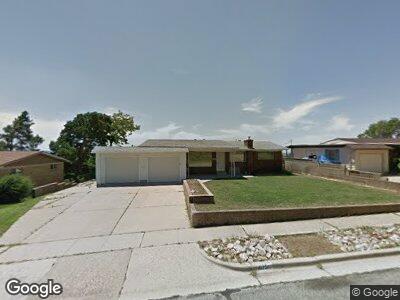
1025 Maxfield Dr Ogden, UT 84404
Horace Mann NeighborhoodEstimated Value: $425,000 - $476,639
4
Beds
3
Baths
2,934
Sq Ft
$154/Sq Ft
Est. Value
About This Home
This home is located at 1025 Maxfield Dr, Ogden, UT 84404 and is currently estimated at $451,410, approximately $153 per square foot. 1025 Maxfield Dr is a home located in Weber County with nearby schools including Mound Fort Junior High School and Ben Lomond High School.
Ownership History
Date
Name
Owned For
Owner Type
Purchase Details
Closed on
Jun 30, 2011
Sold by
Garcia Leo M and Garcia Debra D
Current Estimated Value
Home Financials for this Owner
Home Financials are based on the most recent Mortgage that was taken out on this home.
Original Mortgage
$121,200
Interest Rate
4.55%
Mortgage Type
New Conventional
Purchase Details
Closed on
Jun 2, 2001
Sold by
Garcia Leo M
Bought by
Garcia Leo M and Garcia Debra D
Purchase Details
Closed on
Feb 12, 1998
Sold by
Stoffers Melvin R
Bought by
Garcia Leo M
Home Financials for this Owner
Home Financials are based on the most recent Mortgage that was taken out on this home.
Original Mortgage
$125,644
Interest Rate
6.98%
Mortgage Type
VA
Purchase Details
Closed on
May 19, 1997
Sold by
Walker Linda and Stoffers Virgie
Bought by
Stoffers Melvin R
Create a Home Valuation Report for This Property
The Home Valuation Report is an in-depth analysis detailing your home's value as well as a comparison with similar homes in the area
Home Values in the Area
Average Home Value in this Area
Purchase History
| Date | Buyer | Sale Price | Title Company |
|---|---|---|---|
| -- | -- | Executive Title Ogden | |
| Garcia Leo M | -- | Advantage Title | |
| Garcia Leo M | -- | U S Title | |
| Stoffers Melvin R | -- | U S Title | |
| Stoffers Melvin R | -- | -- |
Source: Public Records
Mortgage History
| Date | Status | Borrower | Loan Amount |
|---|---|---|---|
| Closed | Mcnamee Stuart A | $121,200 | |
| Previous Owner | Garcia Leo M | $122,300 | |
| Previous Owner | Garcia Leo M | $125,644 |
Source: Public Records
Tax History Compared to Growth
Tax History
| Year | Tax Paid | Tax Assessment Tax Assessment Total Assessment is a certain percentage of the fair market value that is determined by local assessors to be the total taxable value of land and additions on the property. | Land | Improvement |
|---|---|---|---|---|
| 2024 | $3,244 | $239,799 | $67,504 | $172,295 |
| 2023 | $3,137 | $234,300 | $67,816 | $166,484 |
| 2022 | $3,298 | $249,150 | $54,281 | $194,869 |
| 2021 | $2,529 | $312,000 | $63,772 | $248,228 |
| 2020 | $2,483 | $283,000 | $48,940 | $234,060 |
| 2019 | $2,581 | $277,000 | $44,058 | $232,942 |
| 2018 | $2,270 | $240,000 | $44,058 | $195,942 |
| 2017 | $1,967 | $192,000 | $39,180 | $152,820 |
| 2016 | $1,834 | $96,376 | $18,840 | $77,536 |
| 2015 | $1,628 | $83,391 | $18,840 | $64,551 |
| 2014 | $1,649 | $83,391 | $16,167 | $67,224 |
Source: Public Records
Map
Nearby Homes
- 1640 Hislop Dr
- 1590 12th St
- 940 Fillmore Ave
- 1272 Maxfield Dr
- 775 Simoron Dr Unit 22
- 1464 S 1650 E Unit 10A
- 1701 E 1470 S Unit 13E
- 777 Simoron Dr
- 1522 Robins Cir
- 1440 7th St
- 1357 Lorl Ln Unit 2
- 1384 Millcreek Dr Unit 6
- 1575 Maddies Cove Unit 15
- 1538 Hudson St
- 1574 Maddies Cove Unit 17
- 1333 Lorl Ln Unit 6
- 1300 Lorl Ln Unit 5
- 466 Simoron Dr
- 1298 Lorl Ln Unit 2
- 1304 Millcreek Dr Unit 5
- 1025 Maxfield Dr
- 1015 Maxfield Dr
- 1035 Maxfield Dr
- 1034 Stowe Dr
- 1028 Stowe Dr
- 1020 Stowe Dr
- 1016 Maxfield Dr
- 1036 Maxfield Dr
- 1014 Stowe Dr
- 1006 Maxfield Dr
- 1045 Maxfield Dr
- 985 Maxfield Dr
- 1040 Maxfield Dr
- 1035 Stowe Dr
- 1010 Stowe Dr
- 1039 Stowe Dr
- 1031 Stowe Dr
- 984 Maxfield Dr
- 1027 Stowe Dr
- 1048 Maxfield Dr