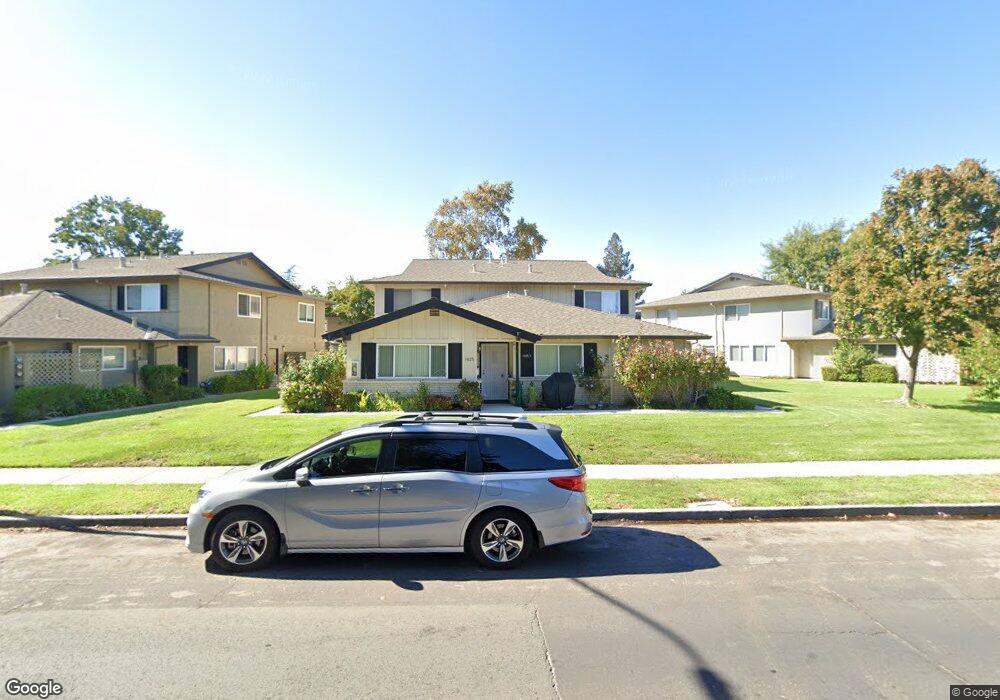
1025 Mohr Ln Unit 4 Concord, CA 94518
Tree Haven NeighborhoodEstimated Value: $304,000 - $424,000
2
Beds
1
Bath
854
Sq Ft
$406/Sq Ft
Est. Value
About This Home
This home is located at 1025 Mohr Ln Unit 4, Concord, CA 94518 and is currently estimated at $346,915, approximately $406 per square foot. 1025 Mohr Ln Unit 4 is a home located in Contra Costa County with nearby schools including Fair Oaks Elementary School, Oak Grove Middle School, and Ygnacio Valley High School.
Ownership History
Date
Name
Owned For
Owner Type
Purchase Details
Closed on
Jun 7, 2017
Sold by
Yap Alain Dave and Yap Sharon R
Bought by
Cherling Christopher John
Current Estimated Value
Purchase Details
Closed on
Sep 10, 2015
Sold by
Avella Francesco
Bought by
Yap Alain Dave and Yap Sharon R
Home Financials for this Owner
Home Financials are based on the most recent Mortgage that was taken out on this home.
Original Mortgage
$189,000
Interest Rate
3.86%
Mortgage Type
Seller Take Back
Purchase Details
Closed on
May 18, 2009
Sold by
Bradley Stephanie and Roth Stephanie
Bought by
Avella Francesco
Purchase Details
Closed on
Dec 9, 1999
Sold by
Ginns Francine A
Bought by
Roth Stephanie
Home Financials for this Owner
Home Financials are based on the most recent Mortgage that was taken out on this home.
Original Mortgage
$83,000
Interest Rate
7.82%
Create a Home Valuation Report for This Property
The Home Valuation Report is an in-depth analysis detailing your home's value as well as a comparison with similar homes in the area
Home Values in the Area
Average Home Value in this Area
Purchase History
| Date | Buyer | Sale Price | Title Company |
|---|---|---|---|
| Cherling Christopher John | $264,000 | Chicago Title Company | |
| Yap Alain Dave | $239,000 | Old Republic Title Company | |
| Avella Francesco | $110,000 | Chicago Title Company | |
| Roth Stephanie | $89,500 | Orange Coast Title |
Source: Public Records
Mortgage History
| Date | Status | Borrower | Loan Amount |
|---|---|---|---|
| Previous Owner | Yap Alain Dave | $189,000 | |
| Previous Owner | Roth Stephanie | $83,000 |
Source: Public Records
Tax History
| Year | Tax Paid | Tax Assessment Tax Assessment Total Assessment is a certain percentage of the fair market value that is determined by local assessors to be the total taxable value of land and additions on the property. | Land | Improvement |
|---|---|---|---|---|
| 2025 | $4,370 | $306,388 | $197,296 | $109,092 |
| 2024 | $4,152 | $300,381 | $193,428 | $106,953 |
| 2023 | $4,152 | $294,492 | $189,636 | $104,856 |
| 2022 | $4,081 | $288,718 | $185,918 | $102,800 |
| 2021 | $3,969 | $283,058 | $182,273 | $100,785 |
| 2019 | $3,883 | $274,665 | $176,868 | $97,797 |
| 2018 | $3,728 | $269,280 | $173,400 | $95,880 |
| 2017 | $3,294 | $243,780 | $155,448 | $88,332 |
| 2016 | $3,181 | $239,000 | $152,400 | $86,600 |
| 2015 | $1,889 | $117,858 | $64,286 | $53,572 |
| 2014 | $1,826 | $115,550 | $63,027 | $52,523 |
Source: Public Records
Map
Nearby Homes
- 1013 Mohr Ln Unit 2
- 1360 Del Rio Ct Unit 4
- 1049 Mohr Ln Unit A
- 1045 Mohr Ln Unit B
- 1040 Mohr Ln Unit A
- 1040 Mohr Ln Unit C
- 1044 Mohr Ln Unit D
- 959 Chandler Ct
- 1023 Bermuda Dr
- 1064 Mohr Ln Unit C
- 1459 Del Rio Cir Unit C
- 1369 Del Rio Cir Unit D
- 1369 Del Rio Cir Unit C
- 1387 Del Rio Cir Unit D
- 1078 Mohr Ln Unit A
- 1218 Hookston Rd
- 1800 Gilardy Dr
- 2050 Monument Blvd
- 1052 Bancroft Rd
- 1795 Klier Dr
- 1025 Mohr Ln Unit 3
- 1025 Mohr Ln Unit 2
- 1025 Mohr Ln Unit 1
- 1021 Mohr Ln Unit 4
- 1021 Mohr Ln Unit 3
- 1021 Mohr Ln Unit 2
- 1021 Mohr Ln Unit 1
- 1029 Mohr Ln Unit 4
- 1029 Mohr Ln Unit 3
- 1029 Mohr Ln Unit 2
- 1029 Mohr Ln Unit 1
- 1020 Mohr Ln
- 1401 Dupre Ct
- 1371 Del Rio Ct Unit 4
- 1371 Del Rio Ct Unit 3
- 1371 Del Rio Ct Unit 2
- 1371 Del Rio Ct Unit 1
- 1039 Mohr Ln Unit D
- 1039 Mohr Ln Unit C
- 1039 Mohr Ln Unit B
Your Personal Tour Guide
Ask me questions while you tour the home.