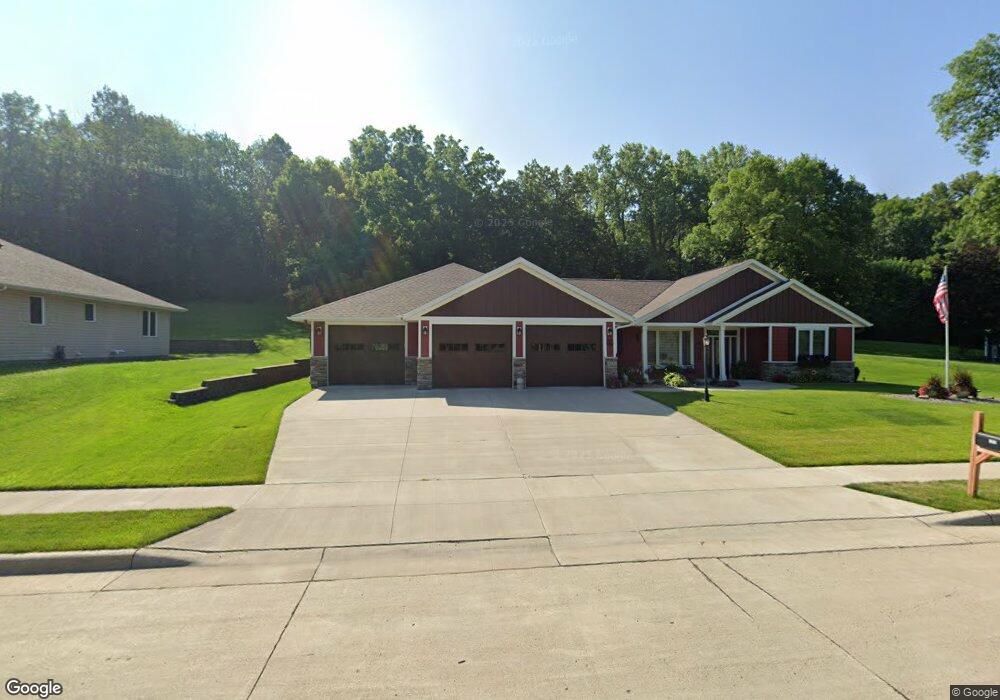
1025 Mosher Ave Owatonna, MN 55060
Estimated Value: $292,000 - $460,875
3
Beds
--
Bath
1,860
Sq Ft
$213/Sq Ft
Est. Value
About This Home
This home is located at 1025 Mosher Ave, Owatonna, MN 55060 and is currently estimated at $395,719, approximately $212 per square foot. 1025 Mosher Ave is a home located in Steele County with nearby schools including Wilson Elementary School, Owatonna Middle School, and Owatonna Senior High School.
Ownership History
Date
Name
Owned For
Owner Type
Purchase Details
Closed on
Mar 22, 2024
Sold by
Pierce Trudy
Bought by
Spande David and Spande Robin
Current Estimated Value
Purchase Details
Closed on
May 7, 2018
Sold by
Mass Restoration Llc
Bought by
Pierce Michael H and Pierce Trudy L
Home Financials for this Owner
Home Financials are based on the most recent Mortgage that was taken out on this home.
Original Mortgage
$150,000
Interest Rate
4.4%
Mortgage Type
New Conventional
Purchase Details
Closed on
Oct 31, 2017
Sold by
Pierce Michael H and Pierce Trudy L
Bought by
Mass Restoration Llc
Purchase Details
Closed on
Sep 25, 2017
Sold by
Mullenmaster Kathy L and Dicks Richard E
Bought by
Pierce Michael H and Pierce Trudy L
Purchase Details
Closed on
Apr 3, 2013
Sold by
Mullenmaster John A
Bought by
Mullenmaster Kathy L
Purchase Details
Closed on
Jan 15, 2013
Sold by
Mullenmaster John A
Bought by
Mullenmaster John A and Kneeland Lorri R
Create a Home Valuation Report for This Property
The Home Valuation Report is an in-depth analysis detailing your home's value as well as a comparison with similar homes in the area
Home Values in the Area
Average Home Value in this Area
Purchase History
| Date | Buyer | Sale Price | Title Company |
|---|---|---|---|
| Spande David | $460,000 | -- | |
| Pierce Michael H | $330,000 | North American Title | |
| Mass Restoration Llc | -- | -- | |
| Pierce Michael H | $25,000 | -- | |
| Mullenmaster Kathy L | -- | -- | |
| Mullenmaster John A | -- | None Available |
Source: Public Records
Mortgage History
| Date | Status | Borrower | Loan Amount |
|---|---|---|---|
| Previous Owner | Pierce Michael H | $150,000 |
Source: Public Records
Tax History Compared to Growth
Tax History
| Year | Tax Paid | Tax Assessment Tax Assessment Total Assessment is a certain percentage of the fair market value that is determined by local assessors to be the total taxable value of land and additions on the property. | Land | Improvement |
|---|---|---|---|---|
| 2025 | $6,242 | $448,200 | $64,500 | $383,700 |
| 2024 | $1,336 | $424,900 | $53,200 | $371,700 |
| 2023 | $1,016 | $385,400 | $49,200 | $336,200 |
| 2022 | $126 | $361,600 | $46,900 | $314,700 |
| 2021 | $44 | $298,606 | $40,964 | $257,642 |
| 2020 | $44 | $283,710 | $40,964 | $242,746 |
| 2019 | $1,310 | $265,776 | $39,200 | $226,576 |
| 2018 | $562 | $95,746 | $35,966 | $59,780 |
| 2017 | $558 | $25,872 | $25,872 | $0 |
| 2016 | $562 | $25,872 | $25,872 | $0 |
| 2015 | -- | $0 | $0 | $0 |
| 2014 | -- | $0 | $0 | $0 |
Source: Public Records
Map
Nearby Homes
- 919 Mosher Ave
- xxx Anderson Place
- 1138 Hawthorne Ave
- 1132 Butternut Ave
- 916 Linn Ave SW
- 640 Lemond Rd
- 318 13th St SW
- 349 13th St SW
- 1031 1031 Grandview Ave
- 1031 Grandview Ave
- 222 W Mckinley St
- 1047 S Oak Ave
- 360 Thomas Ave
- 625 Linn Ave
- 228 13th St SW
- 540 Allan Ave
- 1055 Robert Place SW
- 1031 S Cedar Ave
- 819 819 S Cedar Ave
- 819 S Cedar Ave
- 1015 Mosher Ave
- 1035 Mosher Ave
- 1005 Mosher Ave
- 432 W Mckinley St
- 1050 Anderson Place
- 450 W Mckinley St
- 1060 Anderson Place
- 510 W Mckinley St
- 1041 Anderson Place
- 909 Mosher Ave
- 520 W Mckinley St
- 1070 Anderson Place
- 1051 Anderson Place
- 1014 Almar Place
- 360 Southview St
- 1061 Anderson Place
- 530 W Mckinley St
- 1008 Almar Place
- 350 Riverview Place
- 431 W Mckinley St