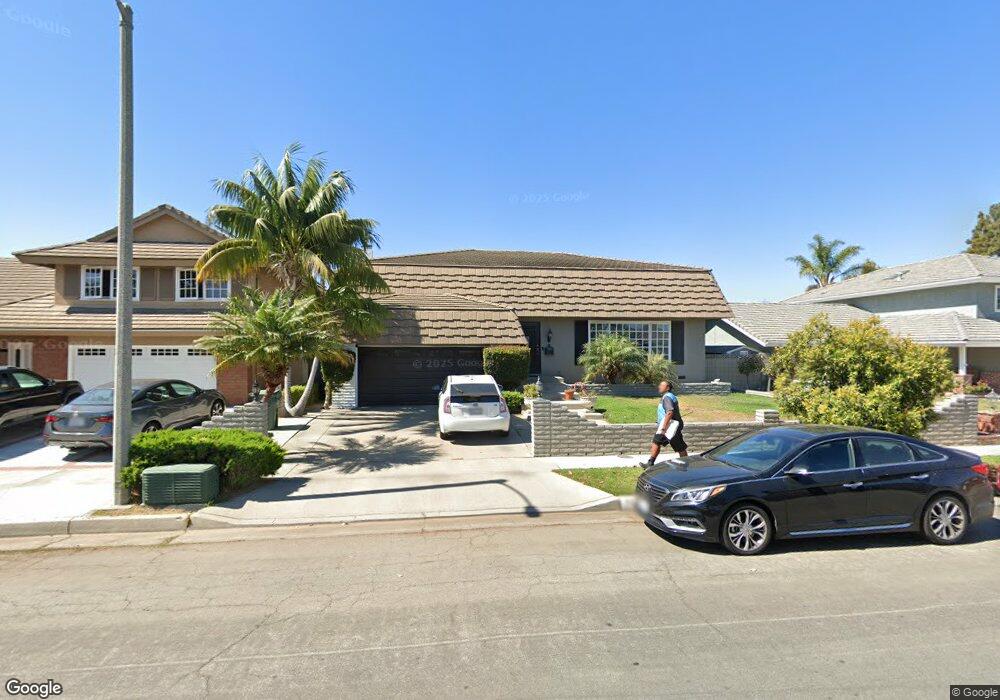
10251 Meredith Dr Huntington Beach, CA 92646
Southeast NeighborhoodEstimated Value: $1,984,583 - $2,357,000
4
Beds
3
Baths
2,924
Sq Ft
$735/Sq Ft
Est. Value
About This Home
This home is located at 10251 Meredith Dr, Huntington Beach, CA 92646 and is currently estimated at $2,150,396, approximately $735 per square foot. 10251 Meredith Dr is a home located in Orange County with nearby schools including Ralph E. Hawes Elementary School, Isaac L. Sowers Middle School, and Edison High School.
Ownership History
Date
Name
Owned For
Owner Type
Purchase Details
Closed on
Sep 22, 2022
Sold by
Nguyen Jeff P and Vo Jessica
Bought by
Jeff Nguyen And Jessica Vo-Nguyen Family Trus
Current Estimated Value
Purchase Details
Closed on
Mar 17, 1998
Sold by
Wayne Gross and Wayne Teresa
Bought by
Nguyen Jeff P and Nguyen Jessica Vo
Home Financials for this Owner
Home Financials are based on the most recent Mortgage that was taken out on this home.
Original Mortgage
$308,000
Interest Rate
7.15%
Purchase Details
Closed on
Jul 10, 1995
Sold by
Green Frances Anna
Bought by
Gross Wayne and Gross Teresa
Home Financials for this Owner
Home Financials are based on the most recent Mortgage that was taken out on this home.
Original Mortgage
$256,000
Interest Rate
7.71%
Create a Home Valuation Report for This Property
The Home Valuation Report is an in-depth analysis detailing your home's value as well as a comparison with similar homes in the area
Home Values in the Area
Average Home Value in this Area
Purchase History
| Date | Buyer | Sale Price | Title Company |
|---|---|---|---|
| Jeff Nguyen And Jessica Vo-Nguyen Family Trus | -- | -- | |
| Nguyen Jeff P | $385,000 | First Southwestern Title Co | |
| Gross Wayne | $320,000 | Chicago Title Co |
Source: Public Records
Mortgage History
| Date | Status | Borrower | Loan Amount |
|---|---|---|---|
| Previous Owner | Nguyen Jeff P | $308,000 | |
| Previous Owner | Gross Wayne | $256,000 | |
| Closed | Nguyen Jeff P | $34,650 |
Source: Public Records
Tax History Compared to Growth
Tax History
| Year | Tax Paid | Tax Assessment Tax Assessment Total Assessment is a certain percentage of the fair market value that is determined by local assessors to be the total taxable value of land and additions on the property. | Land | Improvement |
|---|---|---|---|---|
| 2025 | $7,077 | $625,637 | $409,357 | $216,280 |
| 2024 | $7,077 | $613,370 | $401,330 | $212,040 |
| 2023 | $6,917 | $601,344 | $393,461 | $207,883 |
| 2022 | $6,735 | $589,553 | $385,746 | $203,807 |
| 2021 | $6,609 | $577,994 | $378,183 | $199,811 |
| 2020 | $6,565 | $572,068 | $374,305 | $197,763 |
| 2019 | $6,486 | $560,851 | $366,965 | $193,886 |
| 2018 | $6,385 | $549,854 | $359,769 | $190,085 |
| 2017 | $6,299 | $539,073 | $352,715 | $186,358 |
| 2016 | $6,021 | $528,503 | $345,799 | $182,704 |
| 2015 | $5,962 | $520,565 | $340,605 | $179,960 |
| 2014 | $5,739 | $501,482 | $333,933 | $167,549 |
Source: Public Records
Map
Nearby Homes
- 19941 Carmania Ln
- 10172 Stonybrook Dr
- 19922 Carmania Ln
- 2741 Sandpiper Dr
- 19867 Piccadilly Ln
- 2761 Sandpiper Dr
- 20442 Craimer Ln
- 2055 Calvert Ave
- 19880 Berkshire Ln
- 2036 Mandarin Dr
- 20392 Redwood Ln
- 19860 Claremont Ln
- 19774 Cambridge Ln
- 10101 Theseus Dr
- 9831 Continental Dr
- 9745 Cornwall Dr
- 19843 Coventry Ln
- 9695 Adams Ave
- 9667 Durham Dr
- 19854 Leighton Ln
- 10241 Meredith Dr
- 10252 Wesley Cir
- 10262 Wesley Cir
- 10242 Wesley Cir
- 10231 Meredith Dr
- 10281 Meredith Dr
- 10232 Wesley Cir
- 10252 Meredith Dr
- 10262 Meredith Dr
- 10272 Wesley Cir
- 10221 Meredith Dr
- 10291 Meredith Dr
- 10282 Meredith Dr
- 20201 Craimer Ln
- 10222 Wesley Cir
- 10292 Meredith Dr
- 10211 Meredith Dr
- 20221 Craimer Ln
- 10251 Jon Day Dr
- 10251 Wesley Cir