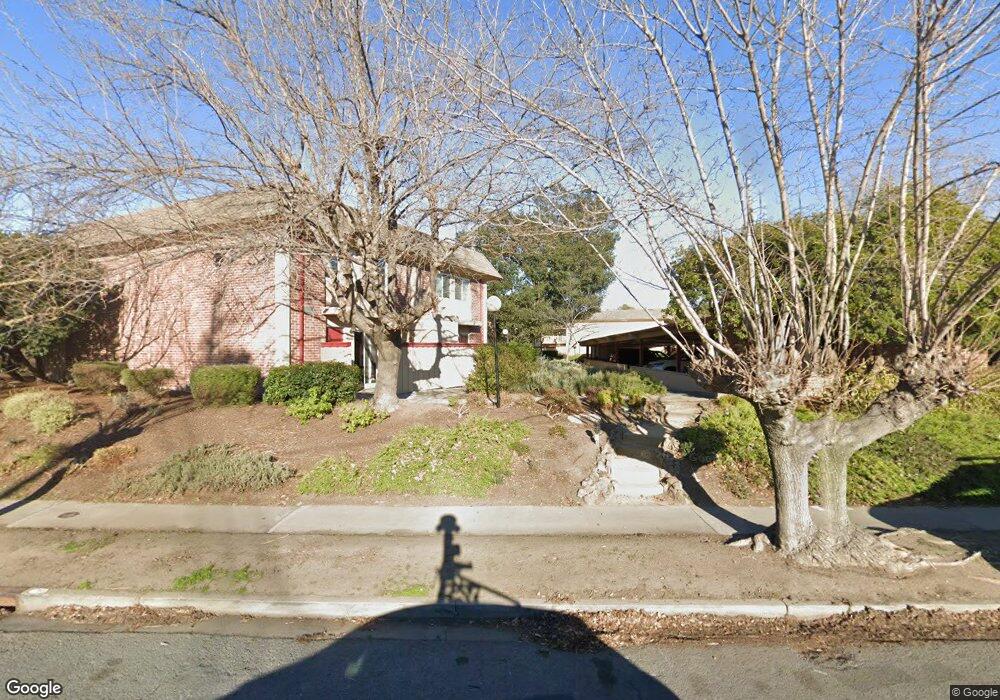
1026 Bancroft Rd Concord, CA 94518
Colony Park NeighborhoodEstimated Value: $499,114 - $633,000
3
Beds
2
Baths
1,386
Sq Ft
$408/Sq Ft
Est. Value
About This Home
This home is located at 1026 Bancroft Rd, Concord, CA 94518 and is currently estimated at $565,279, approximately $407 per square foot. 1026 Bancroft Rd is a home located in Contra Costa County with nearby schools including Fair Oaks Elementary School, Pleasant Hill Middle School, and Ygnacio Valley High School.
Ownership History
Date
Name
Owned For
Owner Type
Purchase Details
Closed on
Jul 2, 2024
Sold by
Gendelman Leonid and Gendelman Larisa
Bought by
Gendelman Revocable Trust and Gendelman
Current Estimated Value
Purchase Details
Closed on
Aug 30, 2000
Sold by
Epstein and Musia
Bought by
Gendelman Leonid and Gendelman Larisa
Home Financials for this Owner
Home Financials are based on the most recent Mortgage that was taken out on this home.
Original Mortgage
$172,000
Interest Rate
8.14%
Mortgage Type
Purchase Money Mortgage
Purchase Details
Closed on
Dec 15, 1997
Sold by
Hall Scott Obrien and Toma Hall Bushra
Bought by
Epstein Bill and Epstein Musia
Home Financials for this Owner
Home Financials are based on the most recent Mortgage that was taken out on this home.
Original Mortgage
$78,750
Interest Rate
9.62%
Mortgage Type
Purchase Money Mortgage
Purchase Details
Closed on
Jul 20, 1996
Sold by
Toma Thouria and Toma Farouk
Bought by
Toma Hall Bushra
Create a Home Valuation Report for This Property
The Home Valuation Report is an in-depth analysis detailing your home's value as well as a comparison with similar homes in the area
Home Values in the Area
Average Home Value in this Area
Purchase History
| Date | Buyer | Sale Price | Title Company |
|---|---|---|---|
| Gendelman Revocable Trust | -- | First American Title | |
| Gendelman Leonid | $215,000 | First American Title Guarant | |
| Epstein Bill | $105,000 | First American Title Guarant | |
| Toma Hall Bushra | -- | -- |
Source: Public Records
Mortgage History
| Date | Status | Borrower | Loan Amount |
|---|---|---|---|
| Previous Owner | Gendelman Leonid | $172,000 | |
| Previous Owner | Epstein Bill | $78,750 |
Source: Public Records
Tax History
| Year | Tax Paid | Tax Assessment Tax Assessment Total Assessment is a certain percentage of the fair market value that is determined by local assessors to be the total taxable value of land and additions on the property. | Land | Improvement |
|---|---|---|---|---|
| 2025 | $4,385 | $323,947 | $97,932 | $226,015 |
| 2024 | $4,196 | $317,596 | $96,012 | $221,584 |
| 2023 | $4,196 | $311,370 | $94,130 | $217,240 |
| 2022 | $4,159 | $305,266 | $92,285 | $212,981 |
| 2021 | $4,057 | $299,281 | $90,476 | $208,805 |
| 2019 | $3,941 | $290,406 | $87,794 | $202,612 |
| 2018 | $3,794 | $284,713 | $86,073 | $198,640 |
| 2017 | $3,664 | $279,132 | $84,386 | $194,746 |
| 2016 | $3,561 | $273,660 | $82,732 | $190,928 |
| 2015 | $3,518 | $269,551 | $81,490 | $188,061 |
| 2014 | $2,834 | $209,000 | $63,184 | $145,816 |
Source: Public Records
Map
Nearby Homes
- 1218 Hookston Rd
- 54 Village Square Place
- 22 Village Square Place
- 192 Mayhew Way
- 1023 Bermuda Dr
- 457 Nora Ct
- 2442 Geraldine Dr
- 2379 Geraldine Dr Unit 1
- 1267 David Ave
- 1013 Mohr Ln Unit 2
- 2050 Monument Blvd
- 1064 Mohr Ln Unit C
- 1488 Dumaine St
- 1078 Mohr Ln Unit A
- 1045 Mohr Ln Unit B
- 1044 Mohr Ln Unit D
- 1369 Del Rio Cir Unit C
- 1040 Mohr Ln Unit C
- 130 Cleopatra Dr
- 2203 Sherman Dr
- 1028 Bancroft Rd
- 1024 Bancroft Rd
- 1022 Bancroft Rd
- 1030 Bancroft Rd
- 1032 Bancroft Rd
- 1034 Bancroft Rd
- 1020 Bancroft Rd
- 1018 Bancroft Rd
- 987 Stimel Dr
- 989 Stimel Dr
- 1036 Bancroft Rd
- 1016 Bancroft Rd
- 1038 Bancroft Rd
- 1012 Bancroft Rd
- 985 Stimel Dr
- 991 Stimel Dr
- 1010 Bancroft Rd
- 1048 Bancroft Rd
- 1216 Hookston Rd
- 1214 Hookston Rd