1026 Bennett St Wilmington, DE 19801
Downtown Wilmington NeighborhoodEstimated Value: $109,000 - $135,000
3
Beds
1
Bath
1,150
Sq Ft
$109/Sq Ft
Est. Value
About This Home
This home is located at 1026 Bennett St, Wilmington, DE 19801 and is currently estimated at $124,918, approximately $108 per square foot. 1026 Bennett St is a home located in New Castle County with nearby schools including The Bayard School, Christiana High School, and Kuumba Academy Charter School.
Ownership History
Date
Name
Owned For
Owner Type
Purchase Details
Closed on
Apr 27, 2023
Sold by
Stevenson Jennelle
Bought by
Sepa Invest Llc
Current Estimated Value
Home Financials for this Owner
Home Financials are based on the most recent Mortgage that was taken out on this home.
Original Mortgage
$73,750
Interest Rate
6.6%
Mortgage Type
New Conventional
Purchase Details
Closed on
May 16, 2022
Sold by
County Of New Castle
Bought by
Ace Securities Corp Home Equity Loan And Trus
Purchase Details
Closed on
Oct 11, 2006
Sold by
Magnet Realty Inc
Bought by
Wheeler Darryl
Home Financials for this Owner
Home Financials are based on the most recent Mortgage that was taken out on this home.
Original Mortgage
$72,000
Interest Rate
9.62%
Mortgage Type
Balloon
Purchase Details
Closed on
Dec 1, 2004
Sold by
Homecomings Financial Network Inc
Bought by
Magnet Realty Inc
Purchase Details
Closed on
Jul 1, 2004
Sold by
Oney Barbara J
Bought by
Homecomings Financial Network Inc
Create a Home Valuation Report for This Property
The Home Valuation Report is an in-depth analysis detailing your home's value as well as a comparison with similar homes in the area
Home Values in the Area
Average Home Value in this Area
Purchase History
| Date | Buyer | Sale Price | Title Company |
|---|---|---|---|
| Sepa Invest Llc | -- | None Listed On Document | |
| Ace Securities Corp Home Equity Loan And Trus | $78,310 | None Listed On Document | |
| Wheeler Darryl | $90,000 | The Security Title Guarantee | |
| Magnet Realty Inc | $25,000 | -- | |
| Homecomings Financial Network Inc | $41,250 | -- |
Source: Public Records
Mortgage History
| Date | Status | Borrower | Loan Amount |
|---|---|---|---|
| Closed | Sepa Invest Llc | $73,750 | |
| Previous Owner | Wheeler Darryl | $72,000 |
Source: Public Records
Tax History
| Year | Tax Paid | Tax Assessment Tax Assessment Total Assessment is a certain percentage of the fair market value that is determined by local assessors to be the total taxable value of land and additions on the property. | Land | Improvement |
|---|---|---|---|---|
| 2024 | $800 | $21,700 | $1,500 | $20,200 |
| 2023 | $780 | $21,700 | $1,500 | $20,200 |
| 2022 | $772 | $21,700 | $1,500 | $20,200 |
| 2021 | $752 | $21,700 | $1,500 | $20,200 |
| 2020 | $730 | $21,700 | $1,500 | $20,200 |
| 2019 | $1,061 | $21,700 | $1,500 | $20,200 |
| 2018 | $822 | $21,700 | $1,500 | $20,200 |
| 2017 | $1,006 | $21,700 | $1,500 | $20,200 |
| 2016 | $1,006 | $21,700 | $1,500 | $20,200 |
| 2015 | $943 | $21,700 | $1,500 | $20,200 |
| 2014 | $942 | $21,700 | $1,500 | $20,200 |
Source: Public Records
Map
Nearby Homes
- 739 E 10th St
- 936 N Spruce St
- 1007 N Spruce St
- 901 N Church St
- 850 Bennett St
- 849 Bennett St
- 847 Bennett St
- 903 Kirkwood St
- 1017 N Pine St
- 1013 N Pine St
- 841 Bennett St
- 836 Bennett St
- DUPLEX ON E 11th St
- 820 N Church St
- 30 E Mccaulley Ct
- 810 N Church St
- 914 N Lombard St
- 912 N Lombard St
- 524 Taylor St
- 508 Taylor St
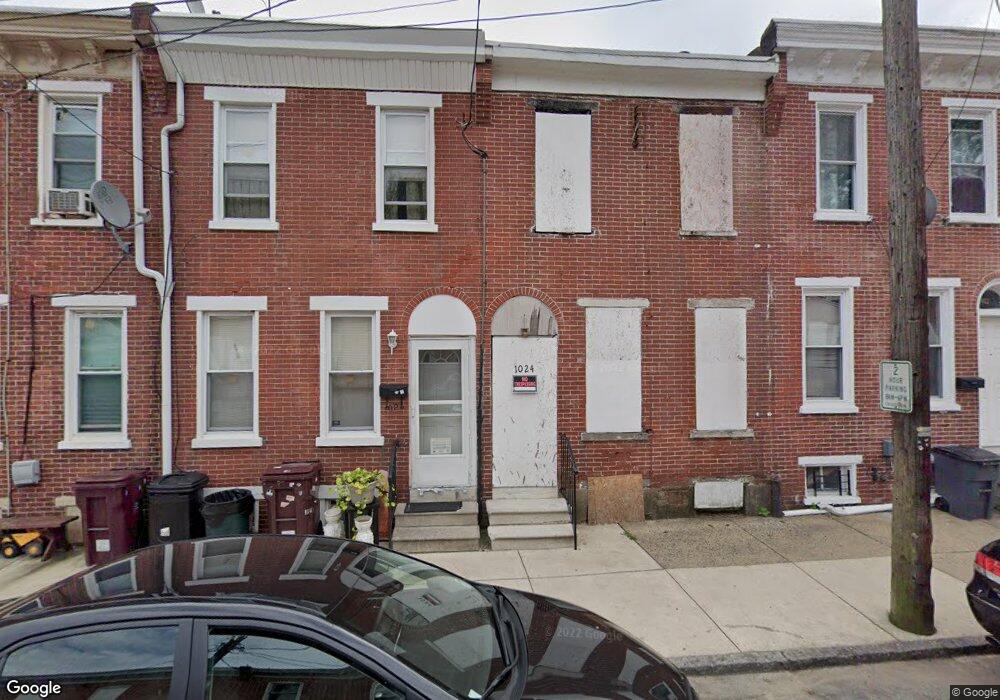
- 1024 Bennett St
- 1028 Bennett St
- 1030 Bennett St
- 1022 Bennett St
- 1020 Bennett St
- 1018 Bennett St
- 1016 Bennett St
- 724 E 11th St
- 726 E 11th St
- 722 E 11th St
- 1021 N Church St
- 728 E 11th St
- 1023 N Church St
- 1019 N Church St
- 1025 N Church St
- 1014 Bennett St
- 1017 N Church St
- 730 E 11th St
- 1015 N Church St
- 732 E 11th St
Your Personal Tour Guide
Ask me questions while you tour the home.