1026 Lucas Rd Mansfield, OH 44905
Estimated Value: $157,142
--
Bed
--
Bath
2,160
Sq Ft
$73/Sq Ft
Est. Value
About This Home
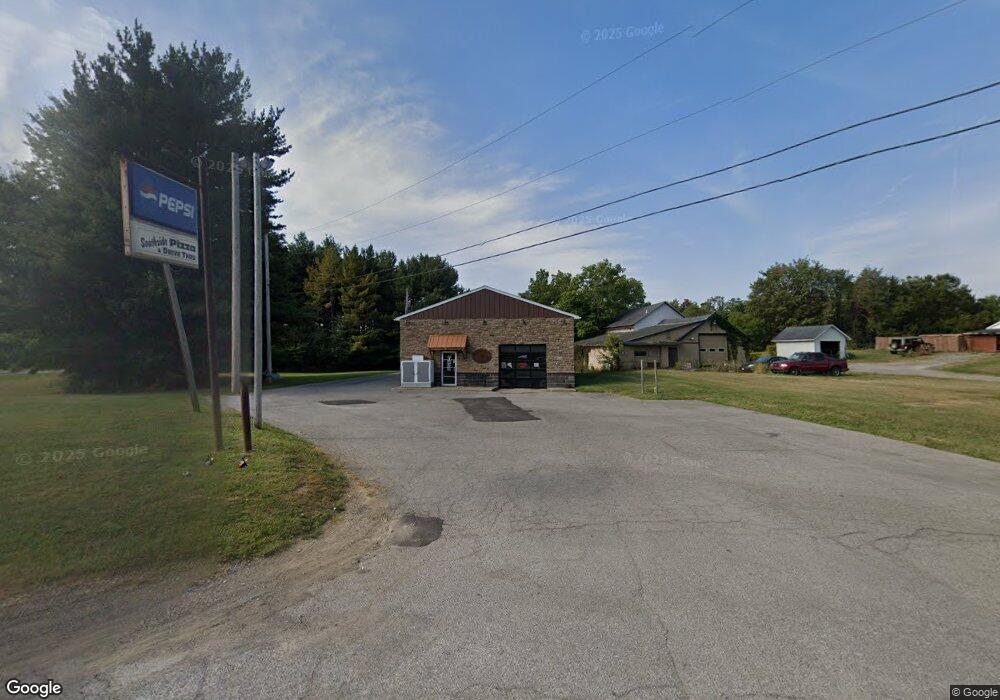
This home is located at 1026 Lucas Rd, Mansfield, OH 44905 and is currently estimated at $157,142, approximately $72 per square foot. 1026 Lucas Rd is a home located in Richland County with nearby schools including Madison High School, Temple-Christian School, and St. Peter's Elementary/Montessori School.
Ownership History
Date
Name
Owned For
Owner Type
Purchase Details
Closed on
Jul 21, 2021
Sold by
Southside Pizza Llc
Bought by
Buckeye Pizza Group Llc
Current Estimated Value
Purchase Details
Closed on
Feb 28, 2020
Sold by
Shaffner Vickie L and Barr Susan R
Bought by
Southside Pizza Llc
Purchase Details
Closed on
May 17, 2004
Sold by
Snavely Bret M
Bought by
Snavely Vickie L
Purchase Details
Closed on
Apr 19, 1994
Sold by
Richmark Inc Glasener Richard
Bought by
Richmark Inc Glasener Richard
Create a Home Valuation Report for This Property
The Home Valuation Report is an in-depth analysis detailing your home's value as well as a comparison with similar homes in the area
Home Values in the Area
Average Home Value in this Area
Purchase History
| Date | Buyer | Sale Price | Title Company |
|---|---|---|---|
| Buckeye Pizza Group Llc | -- | Southern Title | |
| Southside Pizza Llc | $84,000 | Chicago Title | |
| Snavely Vickie L | -- | -- | |
| Richmark Inc Glasener Richard | $90,000 | -- |
Source: Public Records
Tax History Compared to Growth
Tax History
| Year | Tax Paid | Tax Assessment Tax Assessment Total Assessment is a certain percentage of the fair market value that is determined by local assessors to be the total taxable value of land and additions on the property. | Land | Improvement |
|---|---|---|---|---|
| 2024 | $2,534 | $28,030 | $9,640 | $18,390 |
| 2023 | $2,534 | $28,030 | $9,640 | $18,390 |
| 2022 | $2,697 | $28,600 | $8,760 | $19,840 |
| 2021 | $2,688 | $28,600 | $8,760 | $19,840 |
| 2020 | $2,700 | $28,600 | $8,760 | $19,840 |
| 2019 | $2,713 | $28,600 | $8,760 | $19,840 |
| 2018 | $2,618 | $28,600 | $8,760 | $19,840 |
| 2017 | $2,585 | $28,600 | $8,760 | $19,840 |
| 2016 | $2,424 | $27,230 | $8,760 | $18,470 |
| 2015 | $2,424 | $27,230 | $8,760 | $18,470 |
| 2014 | $2,347 | $27,230 | $8,760 | $18,470 |
| 2012 | $2,250 | $27,230 | $8,760 | $18,470 |
Source: Public Records
Map
Nearby Homes