Estimated Value: $440,000 - $516,000
3
Beds
2
Baths
1,267
Sq Ft
$387/Sq Ft
Est. Value
About This Home
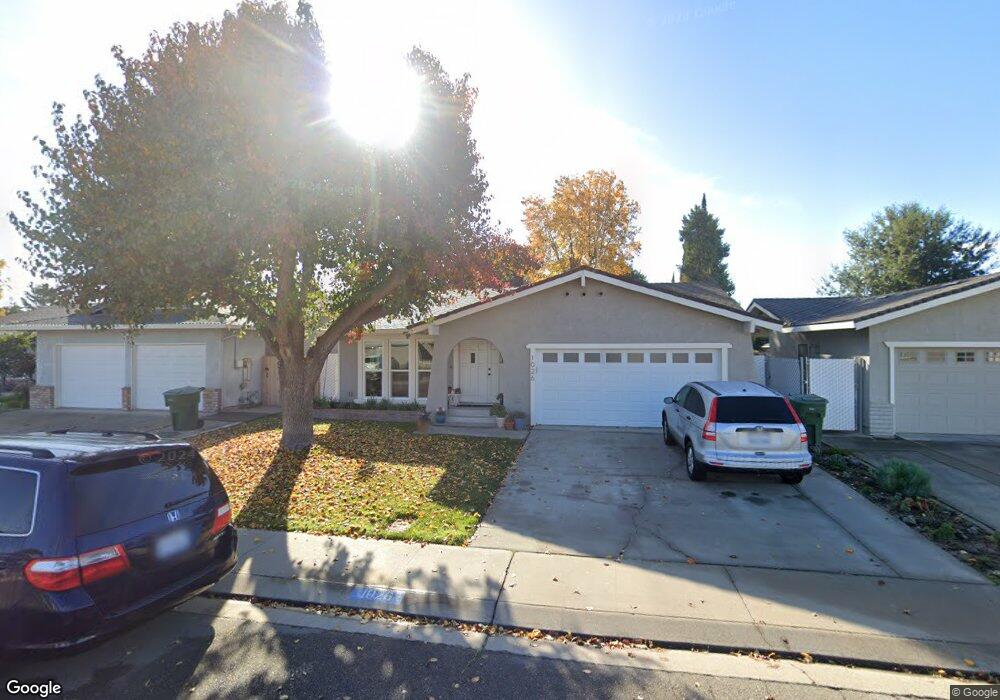
This home is located at 1026 Stuart St, Ripon, CA 95366 and is currently estimated at $489,977, approximately $386 per square foot. 1026 Stuart St is a home located in San Joaquin County with nearby schools including Weston Elementary School, Ripon Elementary School, and Park View Elementary School.
Ownership History
Date
Name
Owned For
Owner Type
Purchase Details
Closed on
Aug 8, 2022
Sold by
Hendricks Nathan and Hendricks Janelle
Bought by
Nathan And Janelle Hendricks Trust and Hendricks
Current Estimated Value
Purchase Details
Closed on
Jun 30, 2021
Sold by
Hand Thomas Robert and The Carol A Hand Family Trust
Bought by
Hendricks Nathan and Hendricks Janelle
Purchase Details
Closed on
Jan 19, 1999
Sold by
Carol Hand
Bought by
Hand Carol Ann and Carol A Hand Family Trust
Create a Home Valuation Report for This Property
The Home Valuation Report is an in-depth analysis detailing your home's value as well as a comparison with similar homes in the area
Home Values in the Area
Average Home Value in this Area
Purchase History
| Date | Buyer | Sale Price | Title Company |
|---|---|---|---|
| Nathan And Janelle Hendricks Trust | -- | Parker Naomi E | |
| Hendricks Nathan | $380,000 | First American Title Company | |
| Hand Thomas Robert | -- | First American Title Company | |
| Hand Carol Ann | -- | -- |
Source: Public Records
Tax History
| Year | Tax Paid | Tax Assessment Tax Assessment Total Assessment is a certain percentage of the fair market value that is determined by local assessors to be the total taxable value of land and additions on the property. | Land | Improvement |
|---|---|---|---|---|
| 2025 | $4,378 | $403,258 | $84,896 | $318,362 |
| 2024 | $4,306 | $395,352 | $83,232 | $312,120 |
| 2023 | $4,218 | $387,600 | $81,600 | $306,000 |
| 2022 | $4,151 | $380,000 | $80,000 | $300,000 |
| 2021 | $1,723 | $157,784 | $54,097 | $103,687 |
| 2020 | $1,707 | $156,167 | $53,543 | $102,624 |
| 2019 | $1,677 | $153,106 | $52,494 | $100,612 |
| 2018 | $1,651 | $150,105 | $51,465 | $98,640 |
| 2017 | $1,619 | $147,162 | $50,456 | $96,706 |
| 2016 | $1,591 | $144,277 | $49,466 | $94,811 |
| 2014 | $1,531 | $139,327 | $47,769 | $91,558 |
Source: Public Records
Map
Nearby Homes
- 916 6th St
- 23811 S Jack Tone Rd
- 138 Roxie Ct
- 1601 Stanley Dr
- 924 Kingery Dr
- 1621 Davis St
- 1691 Davis St
- 1315 Augusta Pointe Dr
- 1122 Zumstein Ct
- 336 Kristen Way
- 1080 Ruess Rd
- 1672 Bailey Dr
- 1434 Augusta Pointe Dr
- 150 N Acacia Ave
- 602 S Highland Ave
- 205 3rd St
- 410 Pine St
- 637 Rebekah Ct
- 663 Clay Way
- 1191 S Mohler Rd
Your Personal Tour Guide
Ask me questions while you tour the home.